Exploring data visualization with D3.js and Cody
James Amoo
Excluding the visually appealing nature of graphically represented data, data represented using images is statistically easier to understand compared to textual data. Suppose you want to convey a rank on some data. You can choose to serially rank the data or adopt a better functionality for visualizing this data using D3.js, an open source JavaScript library for visualizing data.
This article discusses data visualization using D3.js and enhancing your productivity using Cody.
Prerequisites
This article will break down complex concepts to be easily understood. However, to properly follow through, you’ll need:
- Node.js installed on your machine
- Knowledge of JavaScript
- Basic data visualization concepts
- Cody AI assistant installed in your editor.
What is data visualization?
Before we get into the technical aspects, it’s important to understand the concept of data visualization and why we visualize data. One way to convey data is to use text. However, there are situations where textual representation of data does not suffice. For example, showing the rank of some data in ascending order. In conveying data, the most important factor to consider is the comprehension of viewers or anyone who reads the data, which means a conscious effort must be adopted to convey data, through text or graphics.
Data visualization refers to the graphical representation of data using visual elements, such as charts, graphs, maps, and tables.
D3.js
D3.js (or simply D3, short for Data-Driven Documents) is an open source JavaScript library used to visualize data on the web. It is an extremely fast and flexible library. It allows you to express creativity in data visualization using HTML, CSS, and JavaScript (at the basic level). The term “Data-Driven Documents” means the visual elements are dynamically generated from the data provided, which makes D3 exciting to use. You provide the raw data and it generates the visual element. We’ll see how this works in a bit.
Cody AI
A key factor in choosing a library or tool in software development is ease of use, or how well it aids developers’ productivity. With Cody in the picture, this becomes less of a worry because it adds the missing piece to your development workflow.
Cody is an open-source coding AI assistant developed by Sourcegraph that aids your development process by providing context-aware solutions based on your codebase. It has features such as code autocomplete, AI-powered chat with multiple large language models (LLMs), provides explanations on your code, can help optimize code for best practices, and more. In this article, you will learn how Cody helps you enhance productivity when visualizing data with D3.js.
Why use D3.js for data visualization?
The use of D3.js in data visualization is beneficial for many reasons, some of which include:
- Flexibility: As I mentioned earlier, one aspect where D3.js stands tall, especially in comparison with other visualization libraries, is its flexibility. This is particularly interesting for developers looking to explore the full capabilities of data visualization without restriction. Unlike other libraries with pre-built charts, D3.js provides APIs to build any sort of chart you can imagine based on your data.
- Dynamic manipulation: D3.js provides ease in manipulating visual elements. Once you change the values of the data, the visualization automatically updates in tune with that change.
- Scalability: When dealing with graphically represented data or visual elements, developers are often concerned about performance and speed. D3.js is highly scalable for use in small and large projects.
- Support for Animations: D3.js allows you to apply custom animations to your visualizations, making it more engaging and visually appealing.
- Framework Support: As a JavaScript library, D3.js works with all JavaScript frameworks, making it widely used by a highly active community of users.
Getting started with D3.js
Now that you have learned about data visualization and the features of D3.js, it is time to see how it works in our application. In this article, we will be working in a Vanilla HTML environment. You can load D3.js from a CDN like so:
<script type="module">
  import * as d3 from "https://cdn.jsdelivr.net/npm/d3@7/+esm";
</script>
Working principle
D3.js allows developers to bind arbitrary data to the DOM, which makes it easy to manipulate and update data in real-time. In this section, we will go through the basic logic of selecting elements to be visualized, modifying the elements with custom styling, and joining the data.
Selecting elements
The concept of selecting elements in D3.js isn’t so strange, especially from a JavaScript background. Selecting elements basically entails targeting the particular element you want to modify and visualize.
Suppose you want to visualize elements with the class chartbox, you simply use the .chartbox class selector, or a div element selector to select a div element. D3.js provides two methods of selecting elements; the d3.select() method and the d3.selectAll method. The d3.select method selects only the first matching element while d3.selectAll selects all matching instances in the DOM(from top to bottom). Consider the practical example below to learn more about how the select methods work:
<div>
  <h1>Cody by Sourcegraph is the best AI coding assistant</h1>
  <h1>Cody by Sourcegraph is the best AI coding assistant</h1>
  <h1>Cody by Sourcegraph is the best AI coding assistant</h1>
</div>
Then I select the h1 element with the .select() method:
d3.select("h1").style("color", "red");Here’s the result:
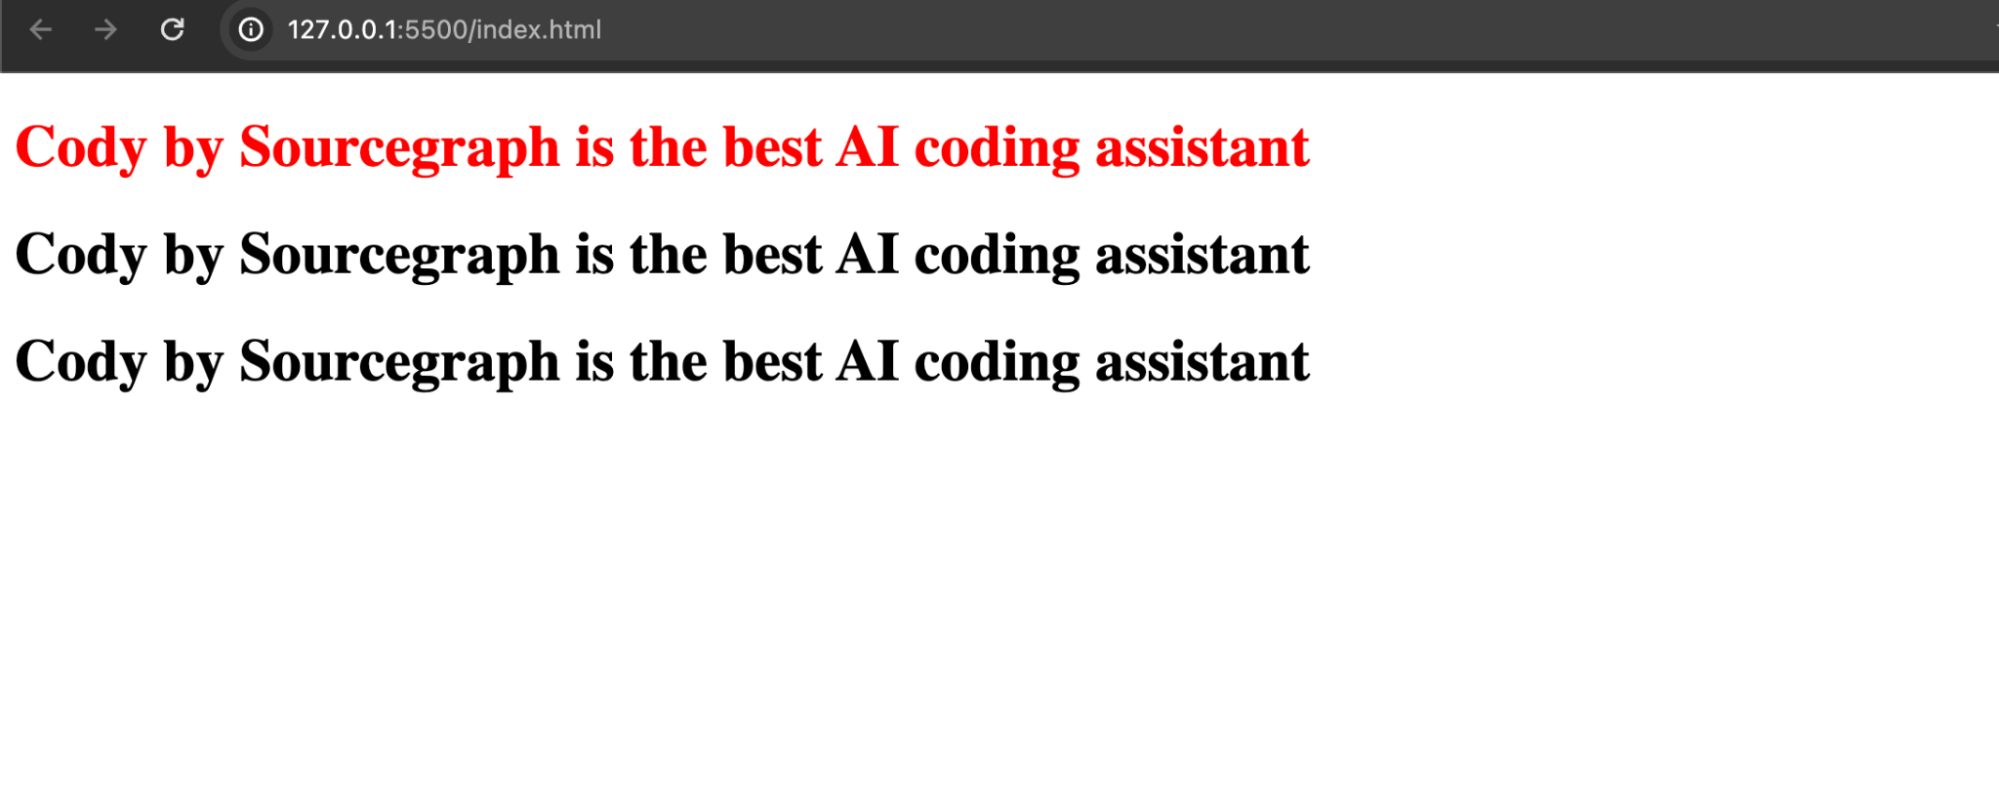
We see that only the first h1 element is affected because we used the .select() method. We can toggle the codebase to target all matching instances of h1 using the .selectAll(). Rather than manually make the changes, we can allow Cody to make further edits or manipulation by simply telling it to do so, since we already established a context in our codebase.
And there! Come on, how interesting is this? I tell Cody to change the method to .selectAll and the color to blue, and then click on accept (since it’s precisely the change I want to make). Here’s the result:
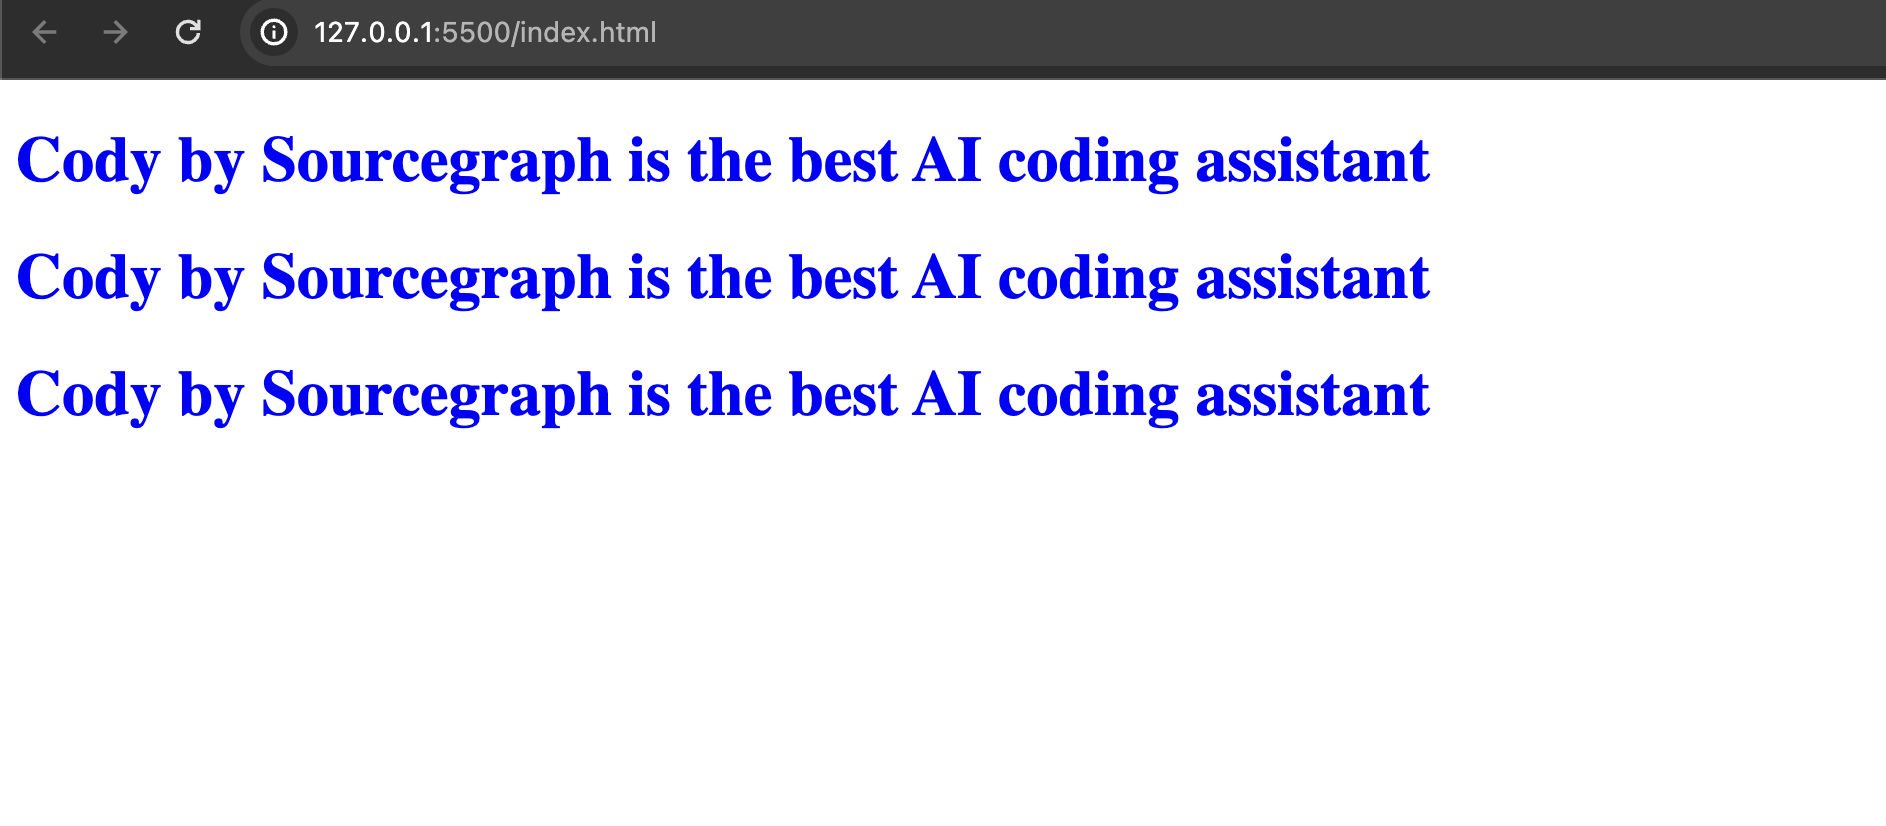
There you go. It acts just as expected, targeting all instances of h1.
Modifying elements
The next step after the selection of elements is to modify them. Yes, you’ve targeted the element, what styles do you want to pass into it? How do you want it to behave? In the previous section, we saw how we could select elements in D3.js and then change the text color of those elements. When an element is selected, several operations can be performed on it, which entails what modifying elements is all about at the basic level. Here’s an example for your understanding:
d3.select("div")
    .attr("class", "container") // adds a class named "container"
    .style("color", "blue")      // changes the color to blue
    .append("h2");               // appends element h2 to div
    .remove()                      // removes selected element from DOM
Joining data
D3.js allows you to bind data from an array to a specified element using the .join() method. This method makes it easy to manipulate data and pass new values to an element. The .join method returns the updated version of the selected element. Let’s see how this works:
let codyFeatures = [
    "Code Autocomplete",
    "Context-aware solutions",
    "Optimize Codebase",
  ];

  d3.select(".cody")
    .selectAll("h1")
    .data(codyFeatures)
    .join("h1")
    .attr("class", "cody")
    .text((d) => d);
Here, I created an array called codyFeatures which contains some features of Cody AI. Then I selected the first element with a class of .cody, passed the array as a parameter in the .data method, and used the .join method to bind the values of the array to the element (in this case, the h1 element). In summary, I dynamically joined the array to the h1 element. Here’s how the result looks:
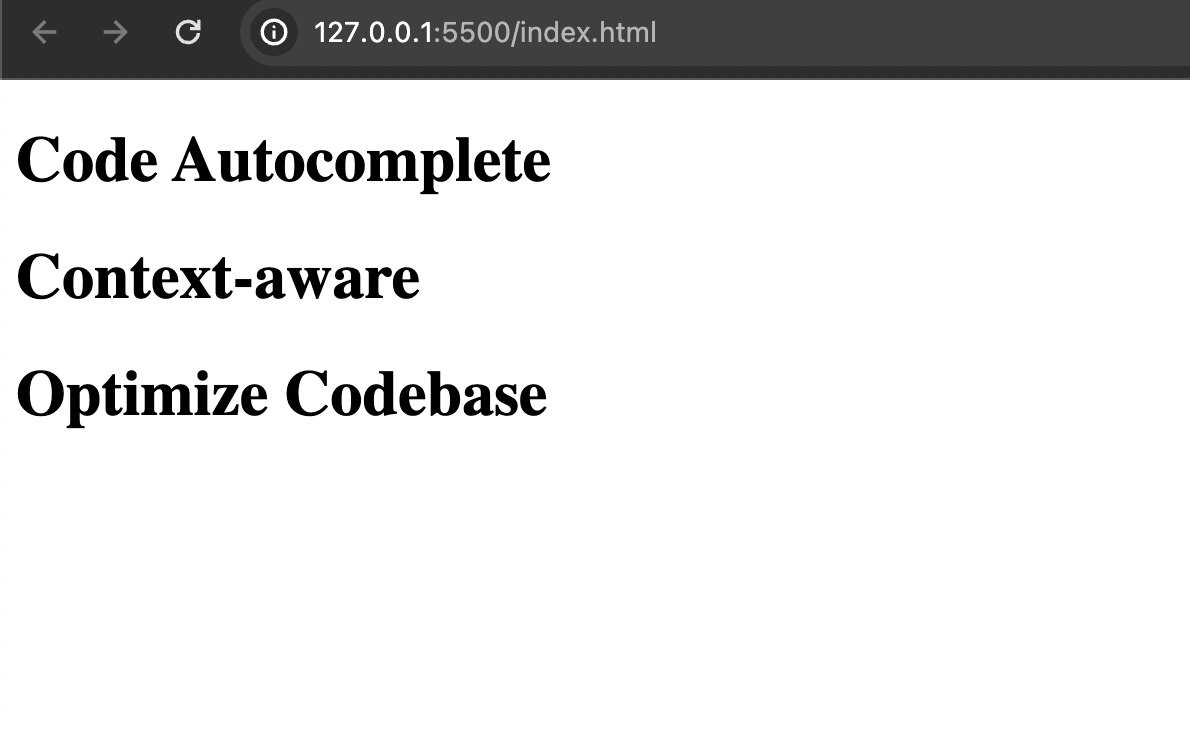
And there! We have our result just as expected.
Visualizing data using charts
Now that we’ve discussed the basic syntax and logic of D3.js. Let’s dive into using some of that logic to create charts to convey some textual data. Here, we want to convey data on a bar chart based on the value in an array of numbers. Let’s start by defining the width and height of our chart.
const width = 600;
const height = 200;
We set our width to 600 so it contains the value of 9 numbers without compression. The next step is to create an array of numbers to represent the data to be visualized.
const values = [100, 90, 80, 60, 50, 40, 30, 20, 10];We now have the dimension of our chart set and our array of numbers defined. The next step will be to create our SVG container using the d3.create() method. SVG helps to visualize data by creating customizable containers. Let’s see how it is done:
const svg = d3.create("svg")
    .attr("width", width)
    .attr("height", height);
After creating an SVG element here, we modify the element just like we discussed earlier. The .attr() method takes in the property and the value. We already defined the values for our width and height earlier. Now, we want to design what each bar of the chart would look like:
 svg.selectAll("rect")
    .data(values)
    .enter()
    .append("rect")
    .attr("x", (d, i) => i * 60)
    .attr("y", d => height - d)
    .attr("width", 50)
    .attr("height", d => d)
    .attr("fill", "purple");
This particular block of code utilizes all the concepts we discussed earlier — selecting elements, modifying elements, and binding elements. We start by selecting all the elements and then bind the values of the array so they correspond to each element. The .enter() method serves as a placeholder for data with no corresponding elements in the DOM. Next, we append the rect element to the SVG to convey a particular piece of data. Then we proceed to evenly space the bars and make sure the height of the bars is based on the values of the numbers. That is, the largest numbers represent the tallest bars. We set the color of the bars to purple(just because that’s the theme at Sourcegraph).
On a final bit, we append our SVG node to the DOM so it reflects on our browser.
let chart = document.getElementById("chart");

chart.append(svg.node());

<div id="chart"></div> //html
Here’s the full code:
const width = 600;
const height = 200;

const values = [100, 90, 80, 60, 50, 40, 30, 20, 10];
const svg = d3.create("svg")
    .attr("width", width)
    .attr("height", height);

svg.selectAll("rect")
    .data(values)
    .enter()
    .append("rect")
    .attr("x", (d, i) => i * 60)
    .attr("y", d => height - d)
    .attr("width", 50)
    .attr("height", d => d)
    .attr("fill", "purple");

let chart = document.getElementById("chart");

chart.append(svg.node());

<div id="chart"></div>
Here’s the result:
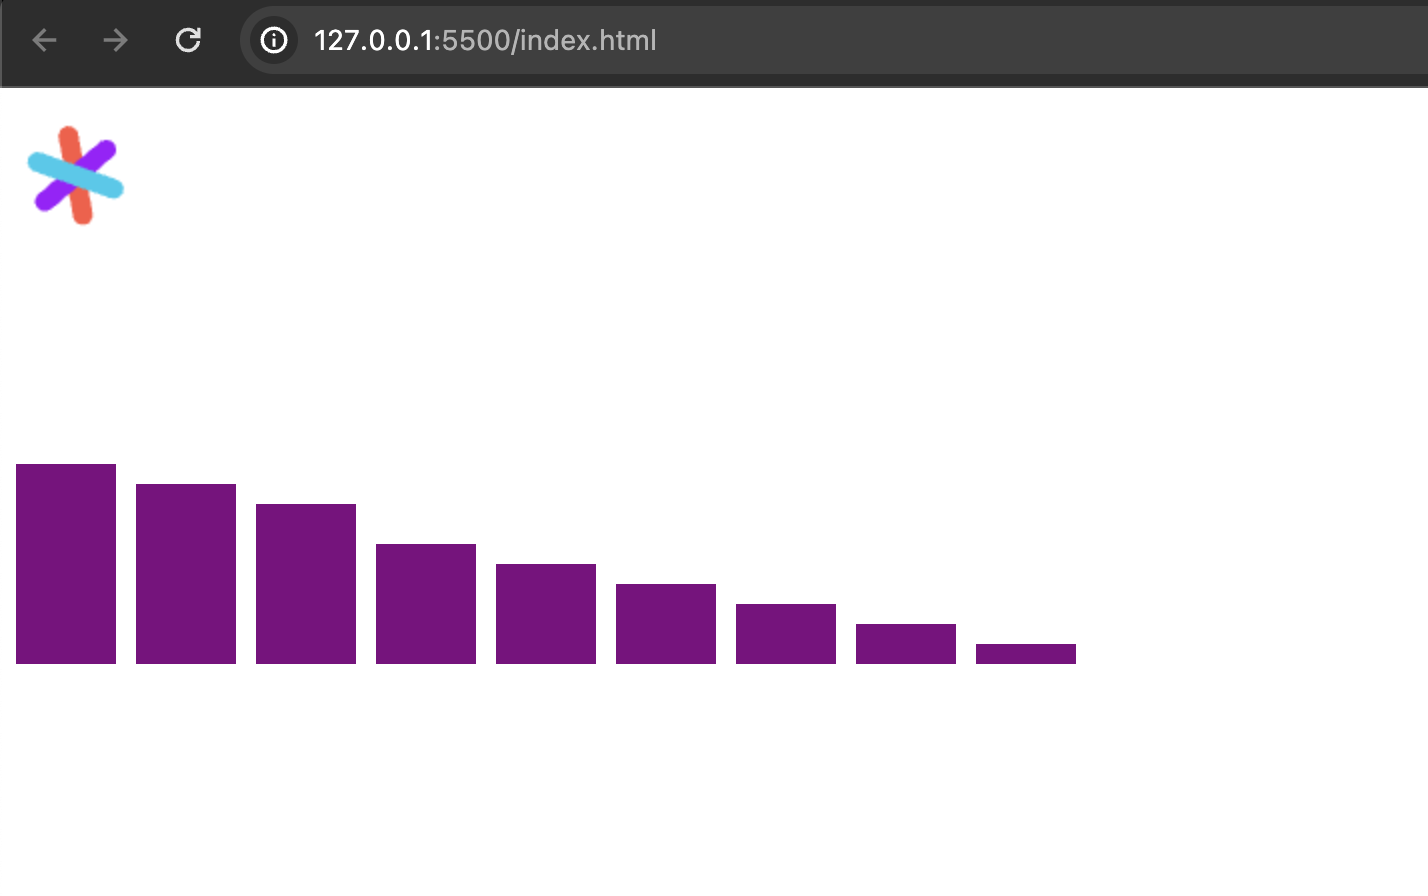
Here, we see the chart is in descending order, just as we arranged the numbers in the array. How about toggling the codebase so our chart appears in ascending order? We can always call on our good old friend, Cody, to help. Let’s give it a try:
And there! I simply tell Cody to modify this code so the chart appears in ascending order. It takes in the highlighted piece of code as context and then provides a context-aware solution by rearranging the values of the numbers of the array. Let’s see how the result looks:
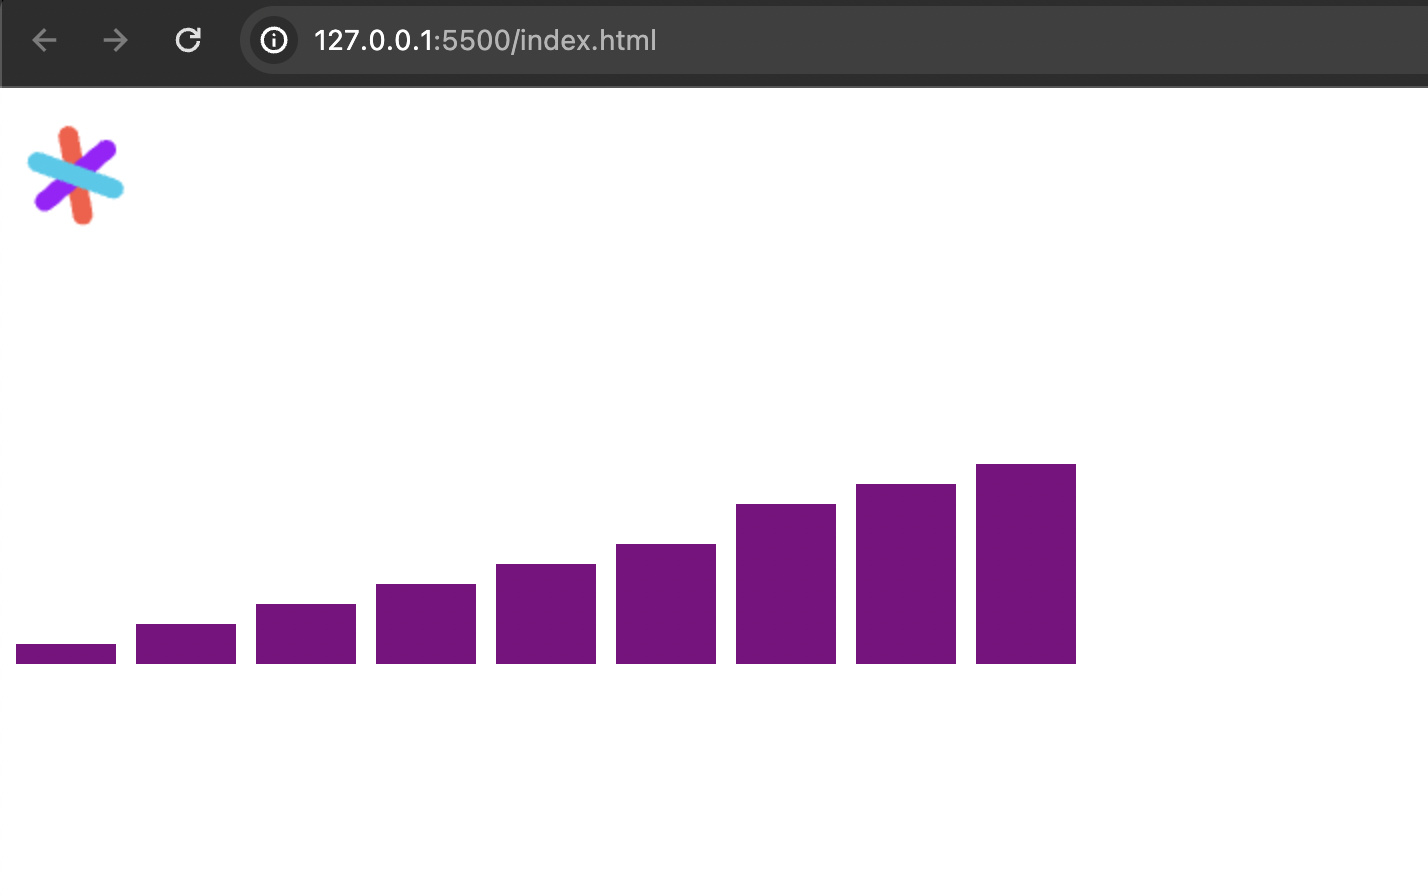
It acts just as we expect it to, in ascending order. I have to say a big thank you to Cody for all the help.
Animation and transition in D3.js
When talking about appealing and eye-catching visualization, we must also talk about animation. Animation, when used correctly, add that extra bit of spice to our visualization and make it better. In this section, we will talk about how to apply animation to your visualization in D3.js.
The .transition() method
This handles the basic functionality of making elements move in D3.js. Without transitions, all elements appear instantaneously on your web browser when loaded or reloaded. Transitions give the flexibility to control the progression of elements on the browser. With the .transition method in D3.js, we can monitor the current state of elements and the target state. So, rather than only working with a single (final) state, we’re working with two states here. The element then moves in tune with the difference in values of the two states. We’ll see how that works in a bit.
The .duration() method
The .duration() method is also important in making transitions at the basic level. As you have probably guessed, it allows us to control the time frame of our animation. You can make your animation slow or fast depending on the particular use case.
Adding animations
Having understood the basic concept of the .transition() and .duration() methods in D3.js, we can then add animation to our chart. First, we need to revisit our codebase and make a few changes to the properties so we have two states; the current state and the desired or target state. Let’s start by providing the width and height of the bars at the current state and then defining it at the target state. At the current state, we have:
svg
    .selectAll("rect")
    .data(values)
    .enter()
    .append("rect")
    .attr("x", (d, i) => i * 60)
    .attr("y", (d) => height - d)
    .attr("width", 0)  // width at current stage
    .attr("height", 0); // height at current stage
Here, we see that the width and height are set to 0, which means it doesn’t exist at the current stage. We can then set some values at the target stage like so:
d3.selectAll("rect")
    .transition() // transition method
    .duration(2000) // duration set to 2000ms
    .attr("fill", "purple") // color of bar set
    .attr("width", 50) // value for width at target stage
    .attr("height", (d) => d); //  value for height at target stage
In the above code, we select all the rect elements with the selectAll method, using the .transition method, and then set our duration to 2000ms which makes the animation run for 2 seconds. Then we proceed to set the styles of the bar at the target stage(remember we set the width and height to zero at the start stage).
Here’s the full code:
// current stage
svg
    .selectAll("rect")
    .data(values)
    .enter()
    .append("rect")
    .attr("x", (d, i) => i * 60)
    .attr("y", (d) => height - d)
    .attr("width", 0)
    .attr("height", 0);

// target stage
  d3.selectAll("rect")
    .transition()
    .duration(2000)
    .attr("fill", "purple")
    .attr("width", 50)
    .attr("height", (d) => d);
Here’s the result:
And there! We’ve added animation to our chart. Feel free to make some changes and explore!
Conclusion
In this article, we learned about data visualizations with D3.js, the features of D3.js, how to get started with D3.js, the working principle and logical structure of visualizing data in D3.js, and how to visualize data using charts in D3.js. Also, we used Cody as a coding assistant to enhance our productivity. Apart from the fact that we made some queries to Cody to help write our code, it was also super helpful with the autocomplete feature as I wrote the code.
Cody can help you code faster, improve your productivity, and unlock new knowledge. Give Cody a try today!