Strange Loop 2019 - Better Integration Tests for Performance Monitoring
Overview
In late 2017, Slack's largest customers were plagued with relentless performance-related outages. Our monolithic, spaghetti codebase was increasingly difficult to reason about; small, innocuous changes might accidentally cause a cascade of regressions. A few concerned engineers teamed up to build a tool detecting and preventing these changes from reaching production. Known as "Slerf" (for "Sl"ack P"erf"ormance), the simple system runs atop Slack's existing unit testing framework and alerts backend engineers early to any potential regressions their code might introduce. Learn how you can extend your own testing framework and improve both the confidence of your engineers and stability of your product while maintaining a high development velocity!
Who is Maude?
Speaker Site: Maude
She'd like to claim she's been programming from a young age, but actually started coding late in her first year of university.
What does she do?
Engineer @ Slack
She spends her time making other developers’ lives simpler, more pleasant, and more productive.
- This is a play on the Slack vision!
What she and her team actually do:
- upgrades to their language stack (HHVM/Hacklang)
- stewardship of their core libraries
- linters, unit tests
- performance regression monitoring
** DISCLAIMER ** Everything below this point is taken directly from the slides Maude presented
Let's rewind the clocks to summer 2017
At the time, we were working in an increasingly growing codebase where it was becoming difficult to keep everything in your head.
Ownership was hard to determine.
Building a new feature in summer 2017!
Building a new feature at the time involved just a few simple steps.
- identify the APIs involved
- find relevant code to modify
- add a few if statements
- grep around for similar code
- add a few more if statements
- ship it
It wasn’t incredibly sustainable given that we were also on-boarding new engineers at a rapid pace.
It was a little bit like trying to launch a fast-food restaurant with a ten-page menu out of a tiny apartment kitchen and trying to increase throughput by throwing more chefs at the problem rather than redesigning the kitchen.

On top of these growing pains, we were also deploying code to production from 0 to 100% of our servers in under a minute.
Anyone want to take a guess as to how many times we deployed during an average San Francisco workday?
- About 100.
We had very few gates and guardrails; we had very little visibility into our a single-line change could impact the performance of our application.
At the time, I was working on a team tasked with improving Slack’s performance on the backend for our largest customers.
Because much of our code was difficult to reason about, it wasn’t uncommon for engineers to cause incidents or sometimes complete outages for these customers with what seemed like a benign change.
It was easy to unknowingly author code which would run out of memory when processing a request on a larger team or introduce O(n) new database queries.
Engineers would test out a change on a development environment, see no performance impact on their tiny test team of ten users and two dozen channels, and ship it!
Our team felt as though we were playing a game of whack-a-mole.
So, in an effort to give ourselves a little bit more time to focus on long-term performance enhancements and step back from constant fire-fighting, we set out to build a tool which would help us identify potential performance regressions before merge.
We decided to ...
Protect themselves from themselves
At the time we were naming a bunch of our tools using some combination of “Slack” and the purpose of the tool.
Our PHP-turned-Hacklang linter is “splinter” for this reason (think TMNT) for “Slack PHP Linter”.
So clearly the only appropriate name for this tool would be:
Slerf
We started with a simple goal: Protect our APIs
Protect our APIs
Protect our API endpoints.
These are the lifeblood of the application – if our application is unable to respond to client requests in a timely manner, Slack enters a degraded state and our customers aren’t happy.
Seems like a good start.
We dug through our usage patterns to identify a set of API endpoints (and corresponding arguments) which are hit most often in a regular workday.
It’s not a perfect metric, but it gives us a good sense of the APIs where our users would most likely notice a performance regression.
We somewhat arbitrarily chose to protect the top 15. Sometimes you make arbitrary decisions and it’s ok.
We built a little bot that ran some queries and reported which APIs were most called over the last 24 hours.
It began alerting in October of 2017 and still alerts today: every Monday, at 3pm in our alerts channel. I’ll show a comparison with a more recent alert later for those who are curious to see the difference two years has made.
I can’t reveal exact numbers (thus the blurring) but I can give you a sense of the scale between some of these APIs at the time.
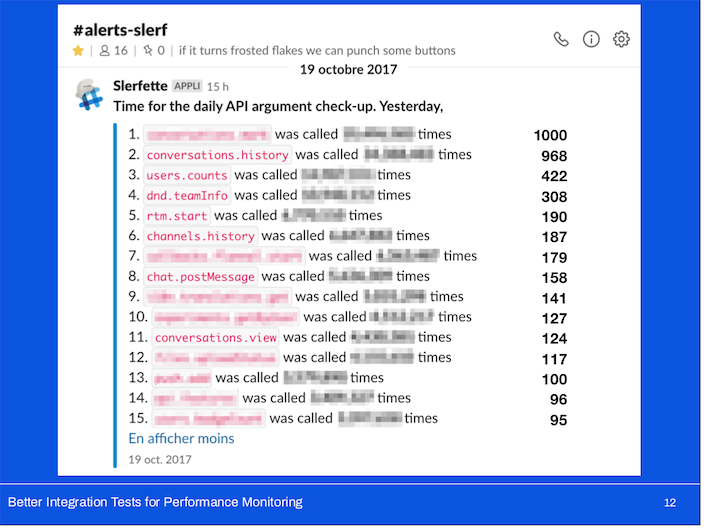
Here we can see that the most-called API (which is not the same!) is called nearly twice the number of times; and the 15th most-called API is called nearly 2.5 times more often the two years ago.
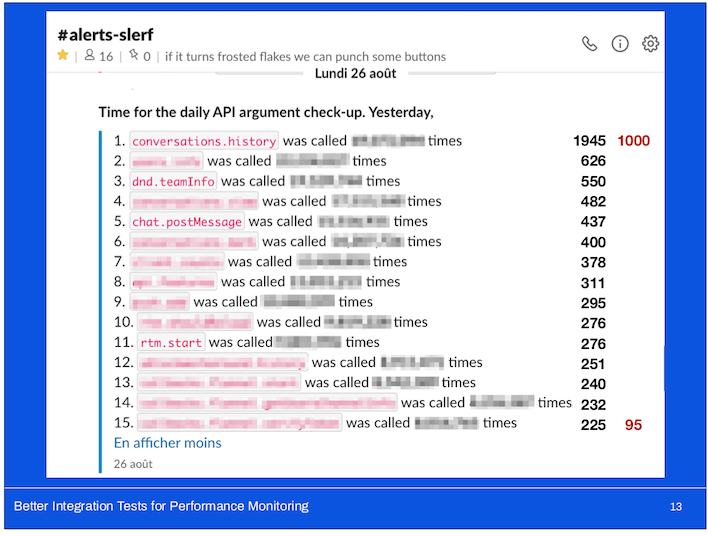
You’ll probably notice that in my Slack screenshots, there’s a bunch of French; I grew up speaking French and before Slack was internationalized, I set it to French to help the team doing the translations. I’ve kept it in French ever since.
Build a low-effort MVP given existing infrastructure
Thankfully, we already had some tools available to us.
Key pieces of existing infrastructure:
- continuous integration
- We had a continuous integration flow triggered by commits pushed up to our GitHub enterprise instance; it enabled us to introduce new merge-blocking test suites.
- QA environments
- We also had access to a number of QA environments to which we could deploy individual branches for testing.
- These machines read from our development databases so any test teams we might’ve created are readily accessible.
- debug logs
- This isn’t technically infrastructure but it was critical nonetheless in getting us up and running quickly: the ability to view information about all of the external dependencies that the application reached out to in order to satisfy the API request.
- This included the two metrics which we cared the most about: number of database queries and number of memcache queries.
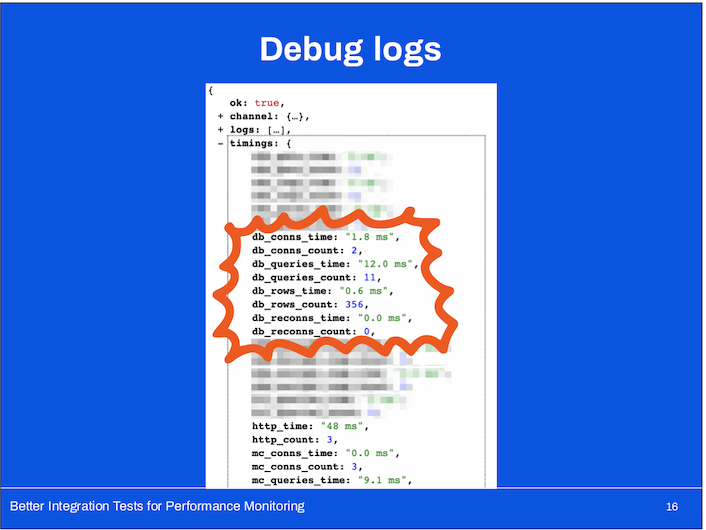
Why number of database and memcache queries?
You may be thinking that this sounds super simplistic or even naïve!
This is what we had in terms of easily accessible information and turns out that our most serious performance problems at the time were nearly always related to DB operations.
Oftentimes we were concerned about hidden linear dependencies which required us to make a large number of roundtrips to our database.
For instance, we discovered at one point that for every unread message in a thread you were subscribed to, when you went to read those messages, we were verifying that you were in the actually in the channel once for every unread message.
In a busy thread, that’s a bad time.
I want to take a second to acknowledge other types of data we might’ve used to spot regressions:
-
We could have looked at timings data but this would have been both unreliable and unrepresentative of application behaviour.
-
Our test infrastructure wasn’t very reliable; sometimes the dev DBs were under different amounts of load throughout the day which would affected our timing data in unpredictable ways.
-
Our QA memcache tier had varying availability throughout the day.
-
If this was a test that we wanted to introduce as a gate to merging code, it needed to be as steady and deterministic; otherwise we’d have a developer mutiny on our hands.
So given all of this, what did Slerf do?
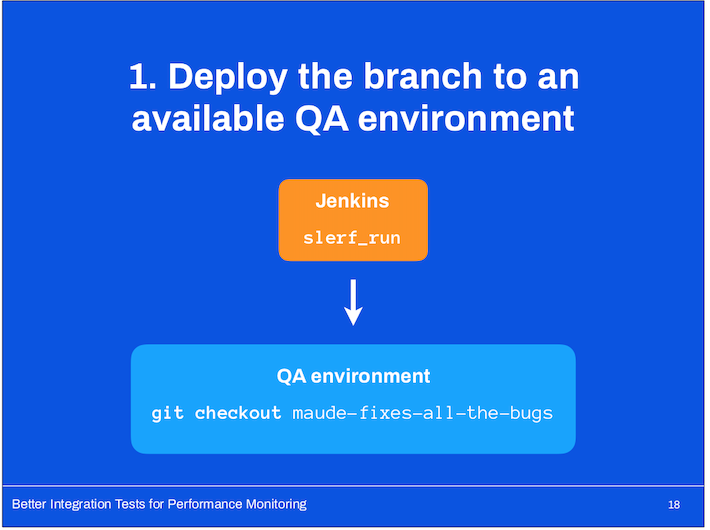
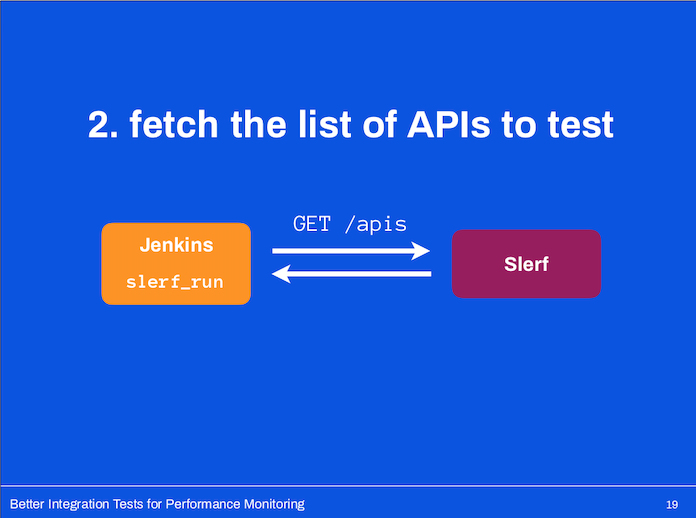
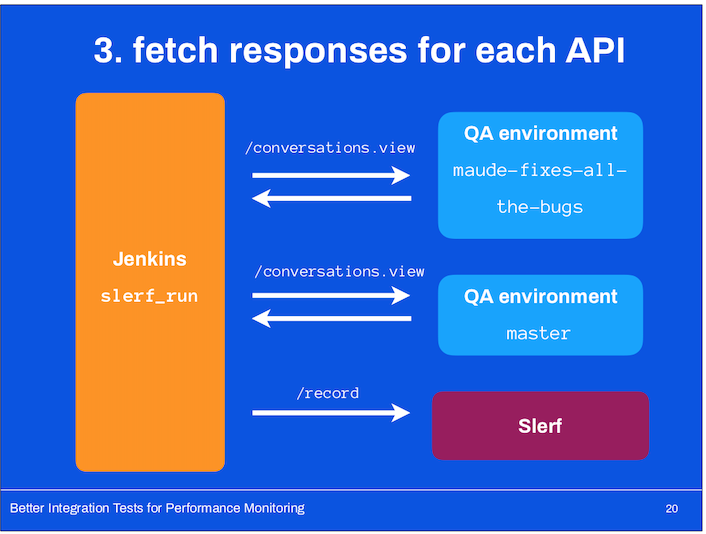
- For each of the APIs we wanted to test, we’d make a request to the QA environment running the developer branch and our main QA environment with a recent version of master (it was updated every ~15 minutes).
- Compare the results: Slerf would compare these generated results and ...
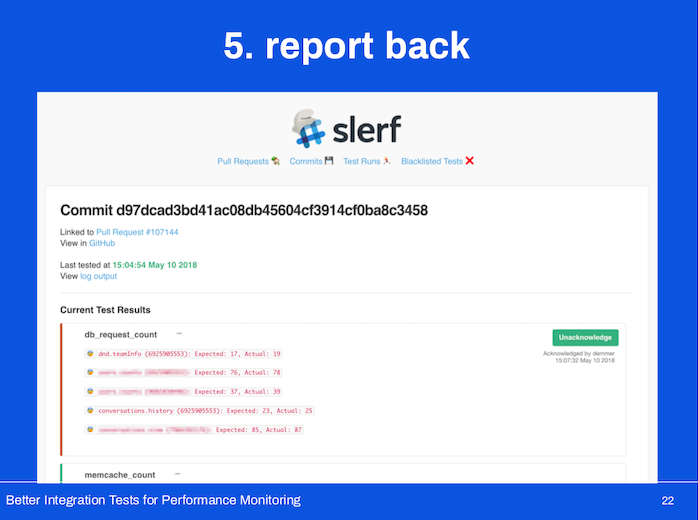
Report back the results to the author!
We unfortunately didn’t report back particularly informative results – because we only logged query counts, we could only report on query counts.
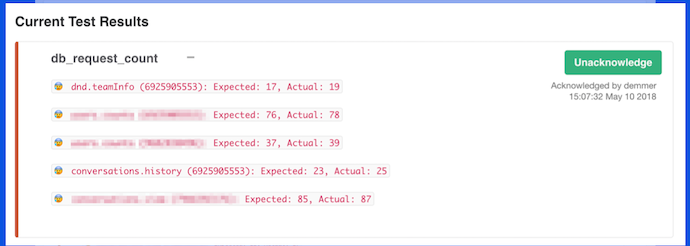
It was up to the code author to figure out where they might’ve introduced any new dependencies.
We weren’t being particularly clever with the metrics we were tracking but we wanted to Slerf to block merges as a warning to engineers. So we made sure there was a middle ground.
If Slerf observed a regression and blocked your PR, you could acknowledge the failure and merge your change. If you felt confident that either the results were wrong or you fully intended to add a new DB dependency, we weren’t going to get in the way of you getting your work done.
The good, the bad, and the ugly
Let’s do a quick retrospective on our first iteration of Slerf.
Overall, we considered the tool a success ...
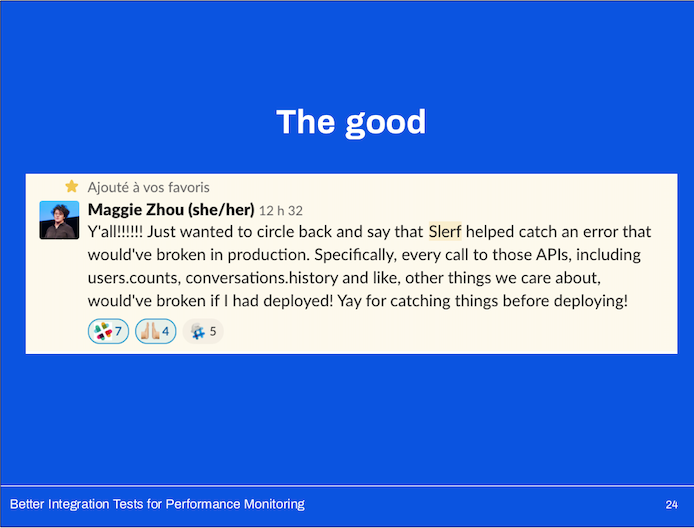
We caught some potential regressions!
Early on, Slerf alerted on changes which would have either considerably slowed a subset of production APIs or, in some cases, almost brought down the entire application.
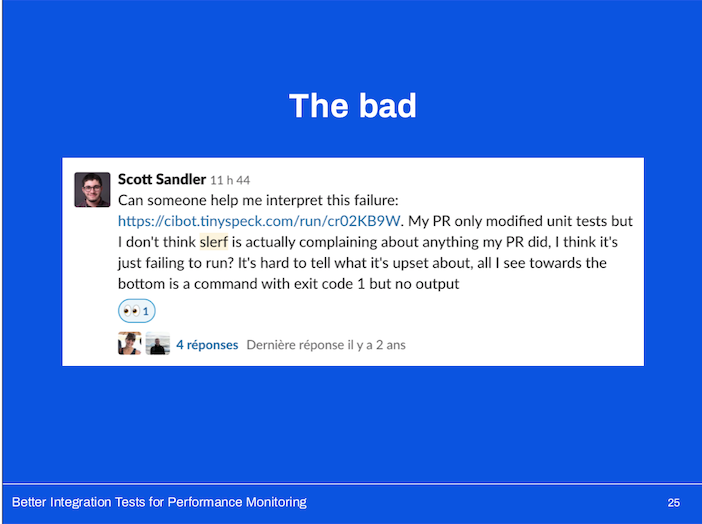
Unfortunately our test infrastructure (namely our QA environments) were very unstable.
Oftentimes our memcache tier would become entirely unavailable and wasn’t uncommon for the test to take over 15 minutes to run because of the time required to deploy a branch to an environment and get it up and running again.
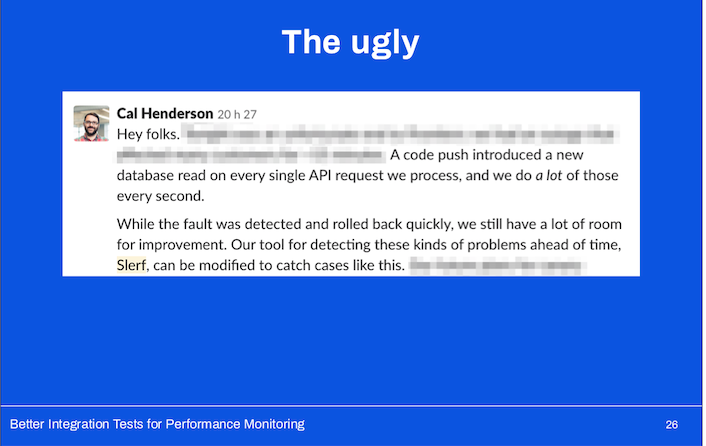
While we could work to stabilize our testing infrastructure and decrease setup time, there were severe limitations to how Slerf worked under the hood.
This became pretty clear about a year after we’d launched Slerf:
The tool issued API requests to a QA environment it treated as a black box.
It had no visibility into what the application was doing beyond the debug output it received.
We were unable to test the performance of our long-running processes (jobs running in our job queue), or web pages backed by Hacklang code. That was a problem.
So we hatched a new plan:
Build a low-effort MVP given existing infrastructure
We sat down and took another look at what was available to us, and that’s when we had the “aha!” moment!
Why not benchmark our integration tests?
What makes using them as our source of benchmarks such a powerful alternative?
Key benefits of existing unit testing infrastructure:
- easily build up and tear down environments unique to each test
- We have an incredible amount of control in our testing environment on the types of teams, channels, and users we can set up to exercise the exact behaviour we want.
- This set up is generally quite speedy and well isolated between individual test cases.
- This is something we can leverage in order to set up specific benchmarking scenarios (rather than relying on a set of generalized development test teams).
- It also enables us to test writes in an isolated manner.
- track database and memcache usage through mocking libraries
- I mentioned previously that we have mocking libraries which kick in at the network boundaries of our application when we’re running unit tests.
- These libraries vary in complexity; some will attempt to mimic the behaviour of the external system with a high degree of fidelity; others will accept an input and return the same, hard-coded output.
- One of our more sophisticated libraries is SQLFake; it provides a near-complete in-memory simulation of MySQL. it was recently open sourced by one of my teammates, and you can check it out on GitHub!
- On the other hand, our memcache mock is rather simple
- it mimics a key-value store in memory rather than a distributed key-value store.
- Because these mocks are developed by us, they give us an incredible amount of flexibility
- we can easily extend them to gather more metrics in exactly the format we want Slerf to consume.
- no external dependencies (no deployment to a QA environment)
- It's also incredibly convenient to be able to run the full suite of tests from our repository directly rather than requiring it be deployed to a QA environment.
- Given we already have a bunch of unit tests, we can start benchmarking existing tests immediately!
- a wide range of existing tests
Hello slerf_benchmark()
We introduced a simple function!
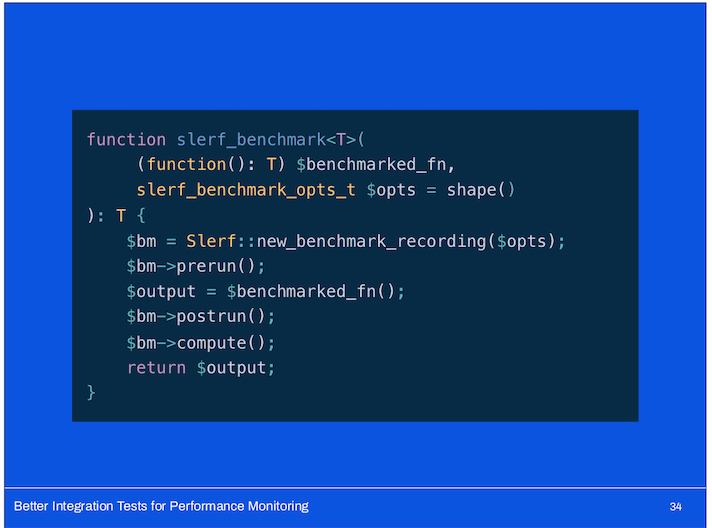
It takes an anonymous function (code to execute) and a set of options.
It creates a new benchmark recording and takes a snapshot of the state of our testing SQLFake and memcache mocks previous to running the code.
It then executes the code it was provided, and takes a snapshot of our mocks immediately afterwards.
It computes the difference between the state observed before and after the benchmarked code was executed and stores the result to an JSON file on the Jenkins CI box.
Finally, it returns the output of the code.
This is an example of what it might look like embedded in a unit test:
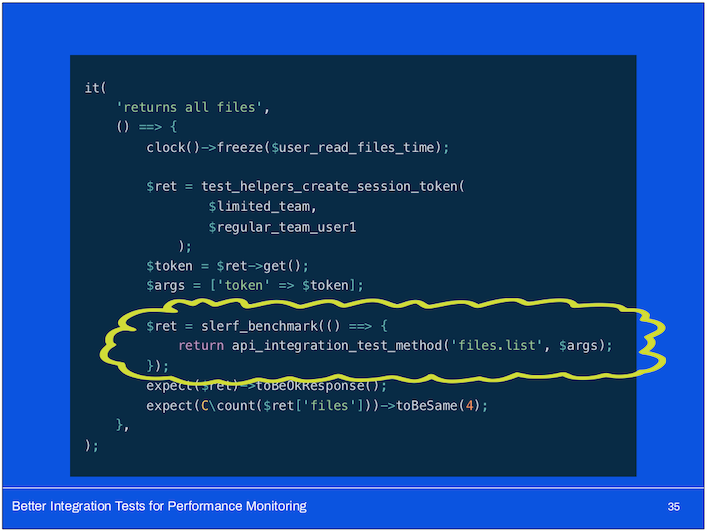
So how does this all work together?
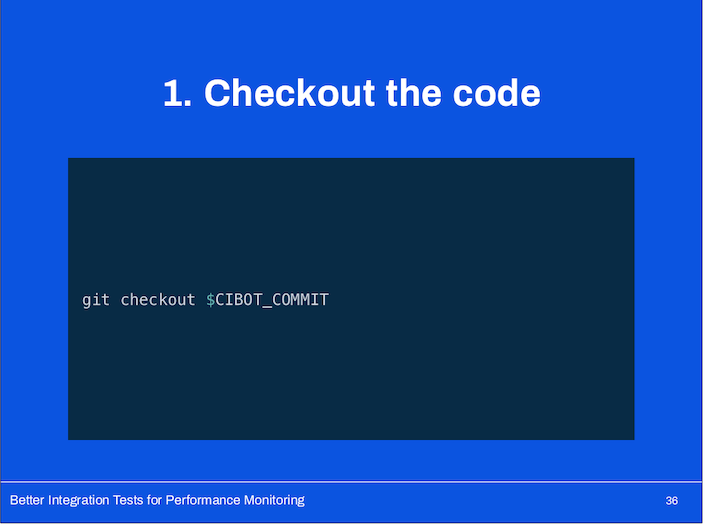
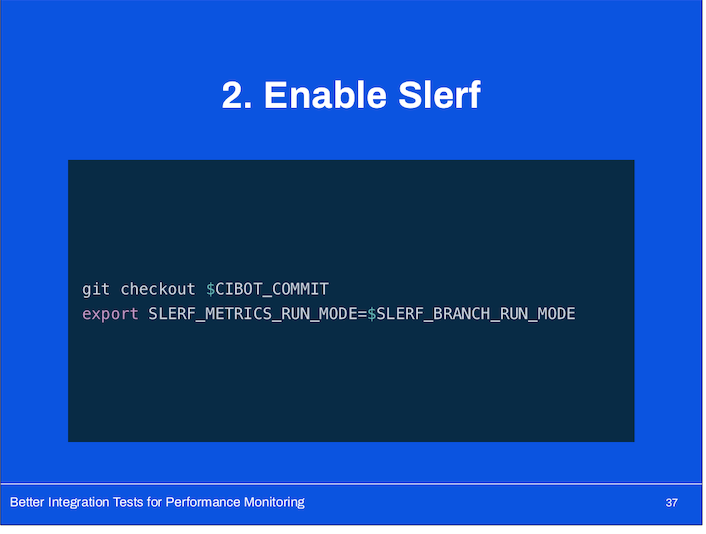
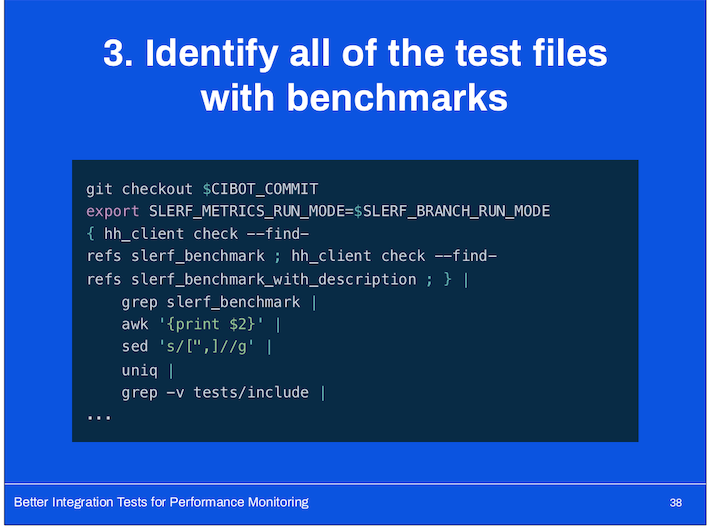
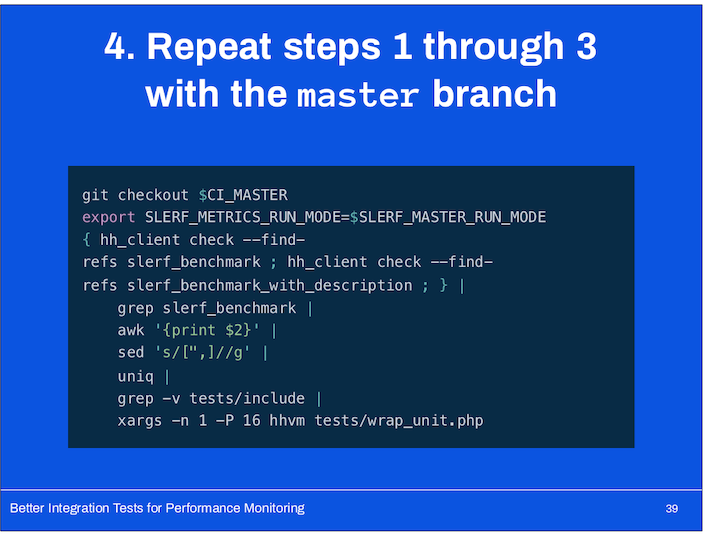
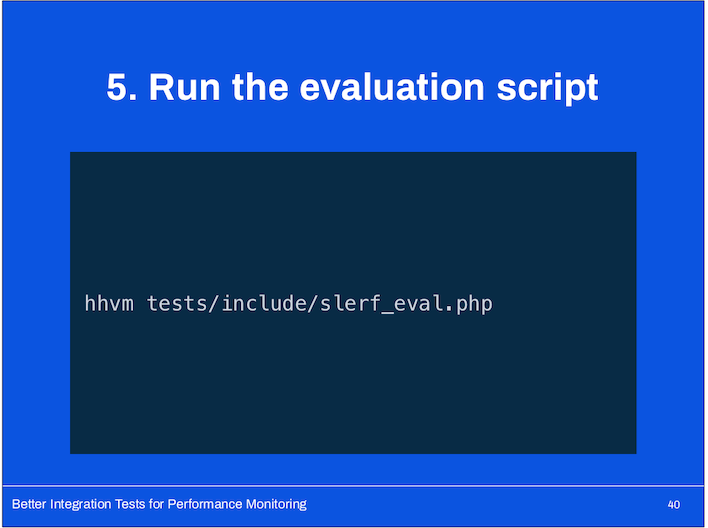
- The evaluation script reads all of the output files and matches up benchmarks by ID (they’re uniquely identified by test name or optional, author-provided name).
- It then compares the number of queries observed on the development and master branches.
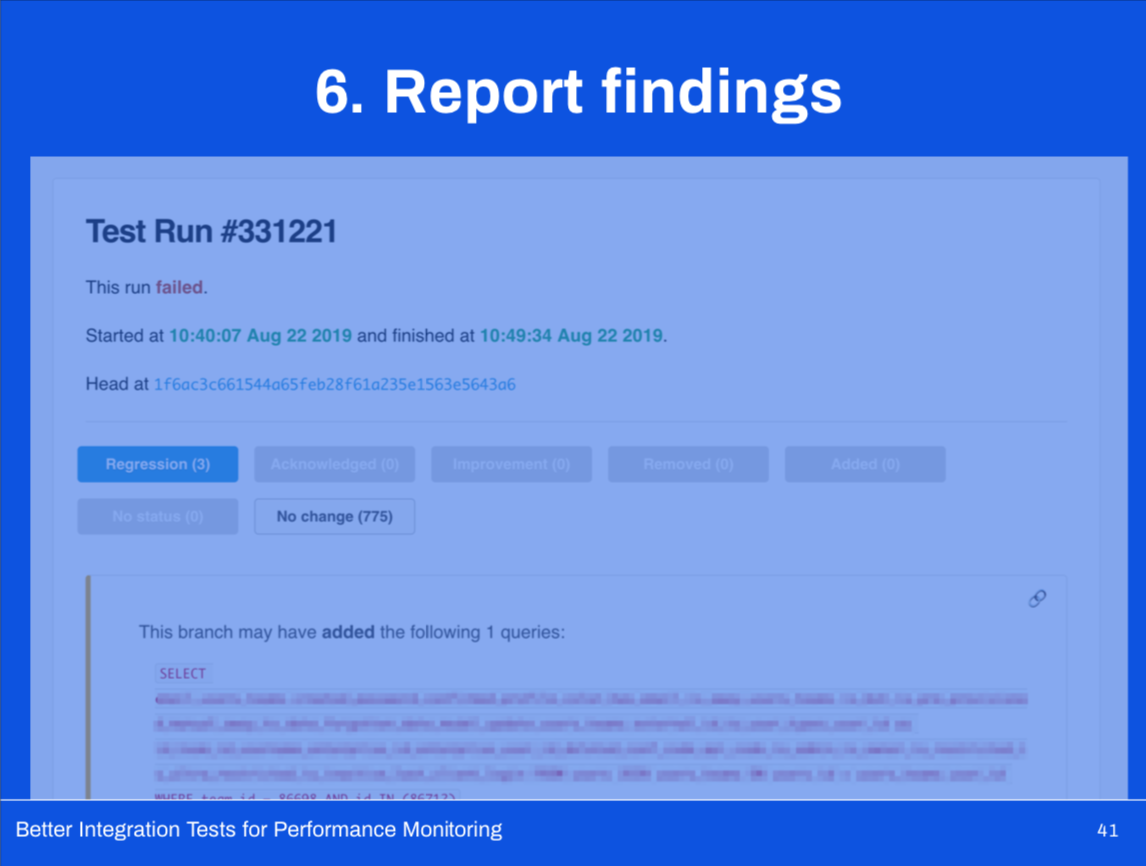
- When running the comparisons, however, it is able to collect much more information about what operations were going on under the hood, giving us much more informative results in the UI.
The good, the bad, and the amazing!
Let’s do a quick retrospective on our second version, now will an integration testing suite able to track potential performance regressions!
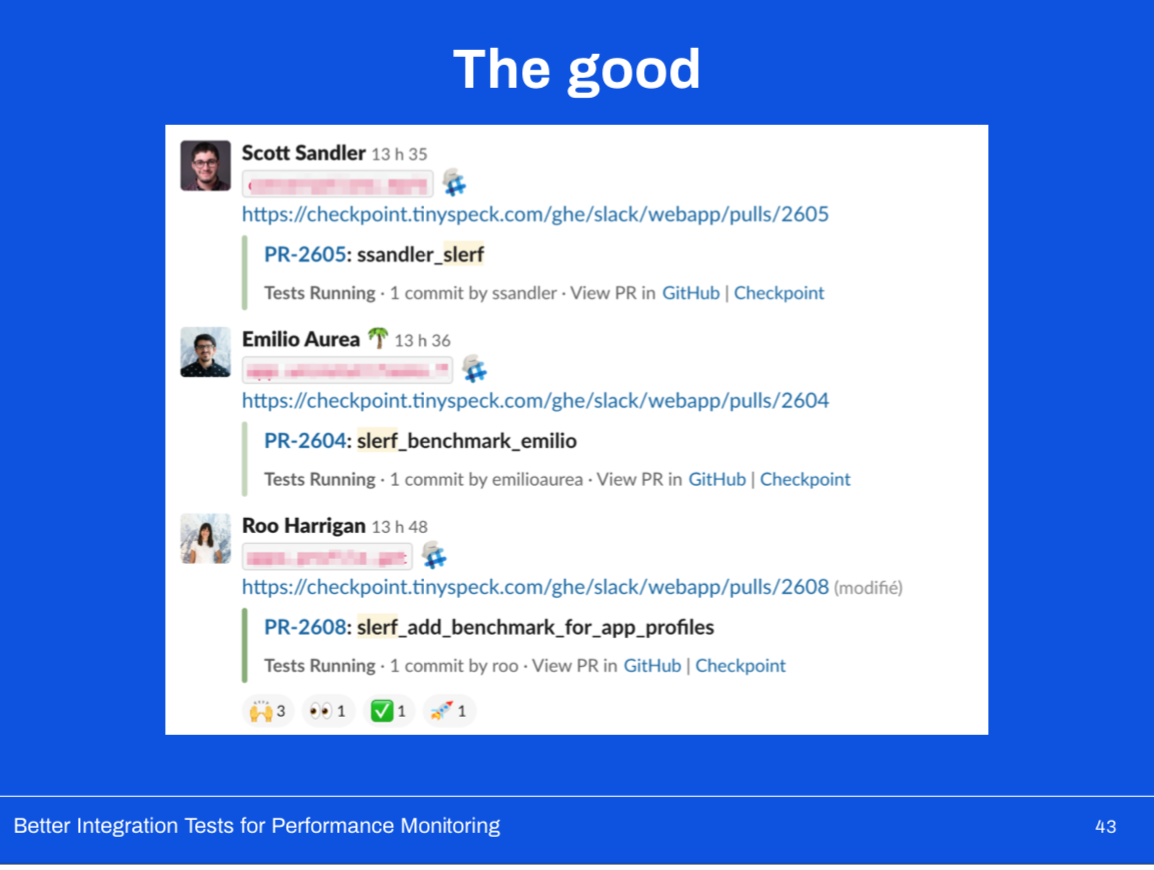
On top of continuing to catch potential regressions before hitting production, it’s now easier than ever to add benchmarks.
We’re benchmarking nearly 800 different codepaths (whereas we were only benchmarking 30 with V1).
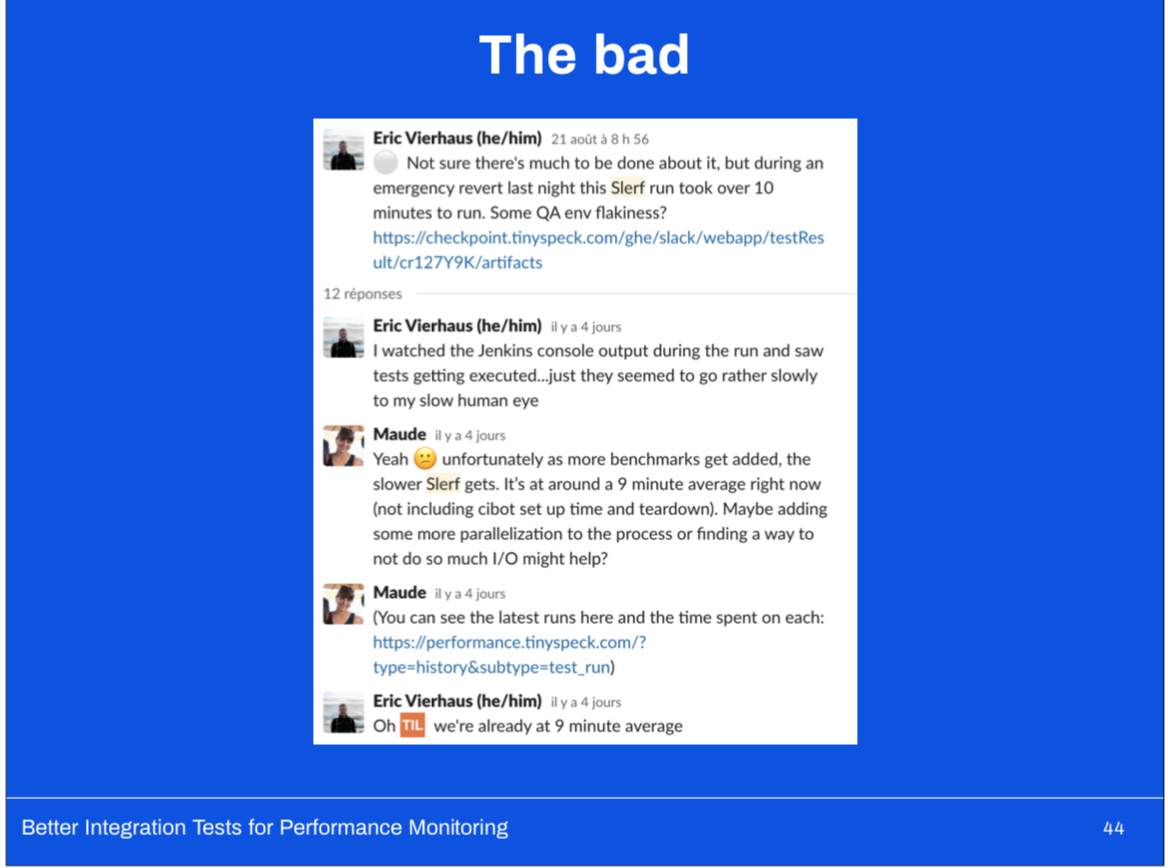
As with any testing suite, as you add more tests, you slow the whole thing down.
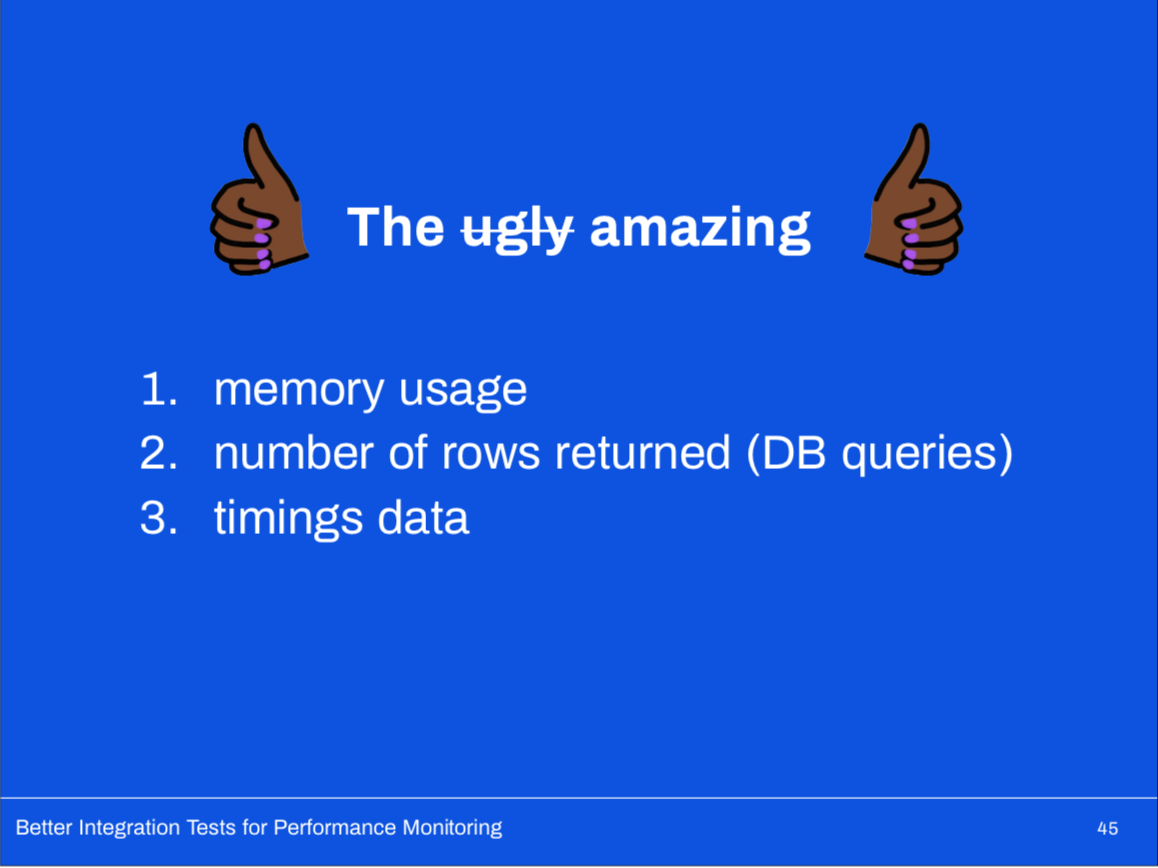
Depending on our mocks makes Slerf incredibly extensible.
We’re looking to introduce metrics around:
- memory usage
- number of rows returned (db queries)
- timings data
Takeaways
If there’s anything you should take away from our experience building Slerf, it’s this:
-
Build from what you have; take inventory of the tools already available to you and you might be surprised to see the many creative ways you can combine them.
- You might not get to an optimal solution, but you might get a surprisingly effective approximation.
-
Gate responsibly.
- What I mean by this is this: if you’re planning to introduce a new test which is able to block merges, think carefully about what you want that interaction to look like.
- We were able to make Slerf a blocking test because we had a way for developers to acknowledge failures and move on.
- We trusted them to make the right call once they’d read the results of the test suite, and that trust has served us well.
** END DISCLAIMER **
Q&A:
- You mentioned earlier you problems where mostly with database/cache, how did you find that out initially?
A: They had a good amount of monitoring, they could look at grafana dashboards that indicated the issues. She had second monitor with graphs of cpu idle time of 5 biggest customers.
- Did you have to do anything in the library to make sure they weren't getting false positives.
A: Had a lot of trouble with user login flow. They had to make sure that if a new query was introduced as part of your branch or master that hit the specific logins table, they would discredit that.