GopherCon 2019 - Two Go programs, three different profiling techniques, in 50 minutes
Anton Velikanov for the GopherCon 2019 Liveblog
Presenter: Dave Cheney | Liveblogger: Anton Velikanov
Overview
Go, being a relatively recent statically typed, compiled language, is known to produce efficient programs. But writing a program in Go is not sufficient for good performance.
All life code session
Dave was doing a life demo of showing 3 different types of profiling:
- CPU Profiling
- Memory Profiling
- Tracing
Dave started with looking through the following example of code which counts the number of words in the text file provided.
package main

import (
	"bufio"
	"fmt"
	"io"
	"log"
	"os"
	"unicode"

	"github.com/pkg/profile"
)

func readbyte(r io.Reader) (rune, error) {
	var buf [1]byte
	_, err := r.Read(buf[:])
	return rune(buf[0]), err
}

func main() {
	defer profile.Start(profile.CPUProfile, profile.ProfilePath(".")).Stop()

	f, err := os.Open(os.Args[1])
	if err != nil {
		log.Fatalf("could not open file %q: %v", os.Args[1], err)
	}

	words := 0
	inword := false
	b := bufio.NewReader(f)
	for {
		r, err := readbyte(b)
		if err == io.EOF {
			break
		}
		if err != nil {
			log.Fatalf("could not read file %q: %v", os.Args[1], err)
		}
		if unicode.IsSpace(r) && inword {
			words++
			inword = false
		}
		inword = unicode.IsLetter(r)
	}
	fmt.Printf("%q: %d words\n", os.Args[1], words)
}The algorithm is doing the following: Check for an EOF and a space - so we can count for words and also check for letters.
Let's build and run this program:
go build
go run main.go
We have some text:
vim moby.txt1.2 MB text of a fine prose.
time ./words moby.txt 181275 words - on average takes 2 seconds
Let’s compare that to unix’s wc -w
time wc -w moby.txt 0.002 seconds 215829 words
We have to make our program to run faster.
First thing we need to do is to profile this program.
Technique 1 - CPU Profiling
import (
        "github.com/pkg/profile"
)

func main() {
        defer profile.Start(profile.CPUProfile, ....).Stop()
        // ...
run this program.

pprof - with pprof the program runs a bit slower, but the benefit is that we have now a profile
go tool pprof -http:8080
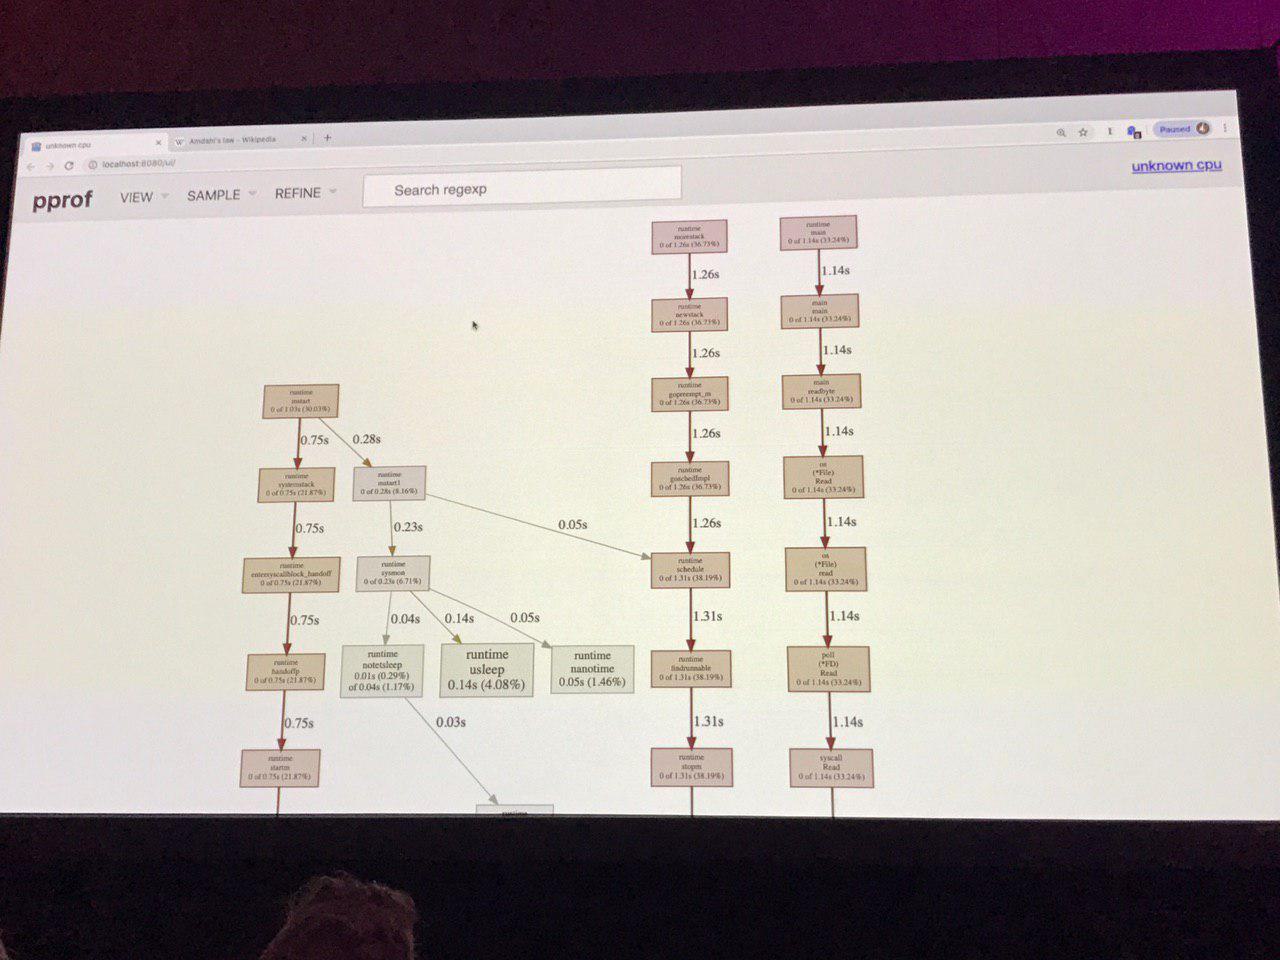
we see here a callstack. We sample callstack of active goroutines and check the goroutines that do the most of work.
Here is what is actually our program:
The biggest contributor: syscall.syscall. Is it too slow? It is using all the time in our program, why? Too many syscalls. Its not that syscall is slow, but all the reading operations are unbuffered.
We don't know for how long the underlying goroutine If the syscall returns fast enough
We fix it - we buffer.
The times are very small now.
The CPU profiling does not show any useful anymore - its just a background noise.
Technique 2 - Memory Profiling
Lets switch from CPU profiling to memory profiling.
time ./words moby.txt
real 0.044 sys 0.006
All the allocations of this program are calling from main readbyte() defer profile.Start(profile.MemProfile, profile.MemProfileRate(1), ....)
We can see every allocation happen inn this program.
reader interface - we don't know what should be passed here in readbyte - all the memory allocations are being ported.
Let reuse the buffer instead allocating it every time on a stack.
var buf[1]
The allocations are tinny now!
We reduced the allocations of this program. go tool pprof -http:8080 mem.pprof
We are only twice as slow as wc
Technique 3 - Tracing
An example that produces a Mandelbrot image
An algorithm runs 1.6s - to generate 1Mb image. Lets see if we can improve it.
Defer profile.Start(profile.CPUProfile, profile.ProfilePath("."))main.paint - 1.10 seconds main.fillPixel - using all the CPU time here. But its hard to improve the algorithm.
Lets use the trace tool to find out.
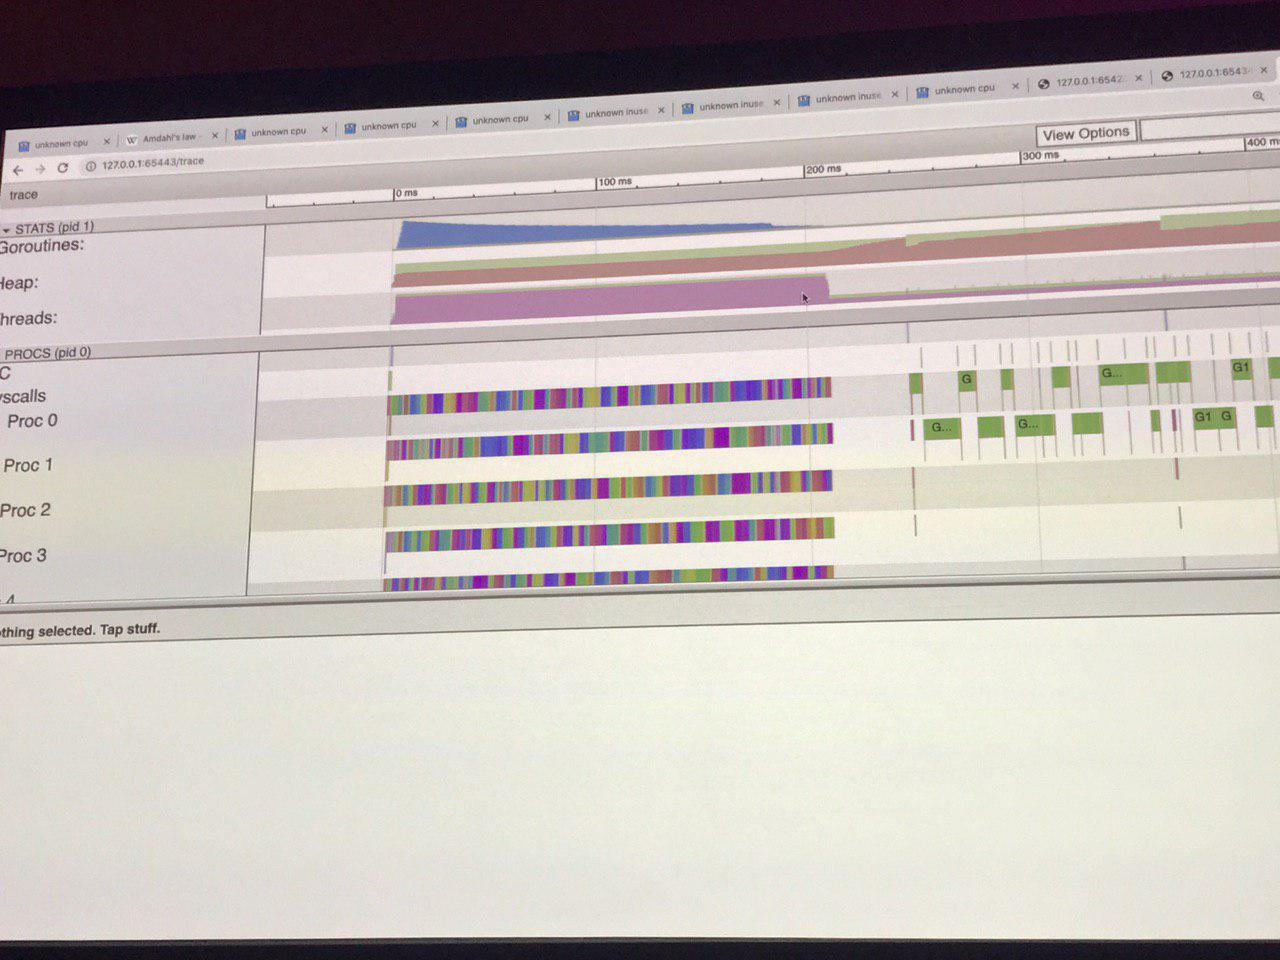
go tool trace trace.outThat is a JavaScript debugger in Chrome. What we can see in this graph: Memory allocations are involved here. We can get the stack trace when we click. Problems:
- Single threaded while composing the image.
We see that the main.fillPixel function was on the CPU the most when pprof captured the stack.
Solution:
- Compute every pixel in parallel
% time ./mandelbrot
real    0m1.654s
user    0m1.630s
sys     0m0.015s
We don't have many goroutines running simultaneously.
We can see from the trace that the program is only using one CPU.
func seqFillImg(m *img) {
	for i, row := range m.m {
		for j := range row {
			fillPixel(m, i, j)
		}
	}
}
Solution:
Using more than one CPU
We saw from the previous trace that the program is running sequentially and not taking advantage of the other CPU's on this machine.
Mandelbrot generation is known as embarrassingly_parallel. Each pixel is independent of any other, they could all be computed in parallel. So, let’s try that.
% go build mandelbrot.go
% time ./mandelbrot -mode px
2017/09/17 13:19:48 profile: trace enabled, trace.out
2017/09/17 13:19:50 profile: trace disabled, trace.out

real    0m1.764s
user    0m4.031s
sys     0m0.865s
Now the algorithm runs on a multiple chunks but we have gasps.
Batching up work
Using one goroutine per pixel was too fine grained. There wasn't’t enough work to justify the cost of the goroutine.
Instead, let’s try processing one row per goroutine.
% go build mandelbrot.go
% time ./mandelbrot -mode row
2017/09/17 13:41:55 profile: trace enabled, trace.out
2017/09/17 13:41:55 profile: trace disabled, trace.out

real    0m0.764s
user    0m1.907s
sys     0m0.025s
This looks like a good improvement, we almost halved the runtime of the program. Let’s look at the trace.
We have 1000 goroutines but we have 1000 time more work to do.
The time to compute the image is 200 ms and the time to write the image is also 200ms which is good!

Using workers
In the main goroutine we queue the work using buffers channel
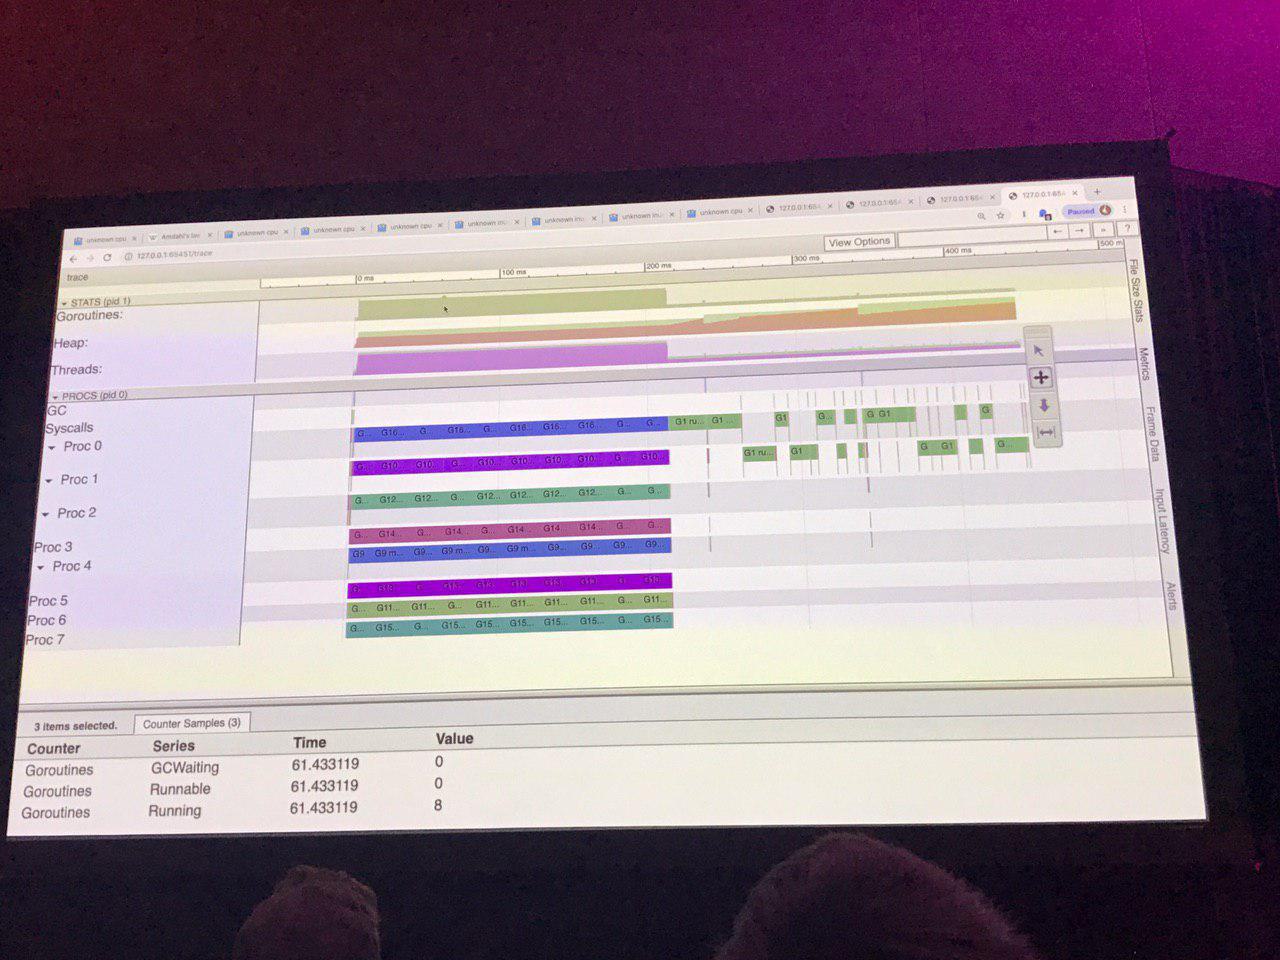
-mode worker -workers = 8 (The number of CPU's Dave has)
Looks similar with the only difference: Fixed number of goroutines now.
Did it much difference in practice?
- fixed number of goroutines?
- Or many goroutines? Depending on the use case. 2 strategies but they deliver pretty much the same result.
Boost the performance of the code - nearly 4 times!

Conclusion

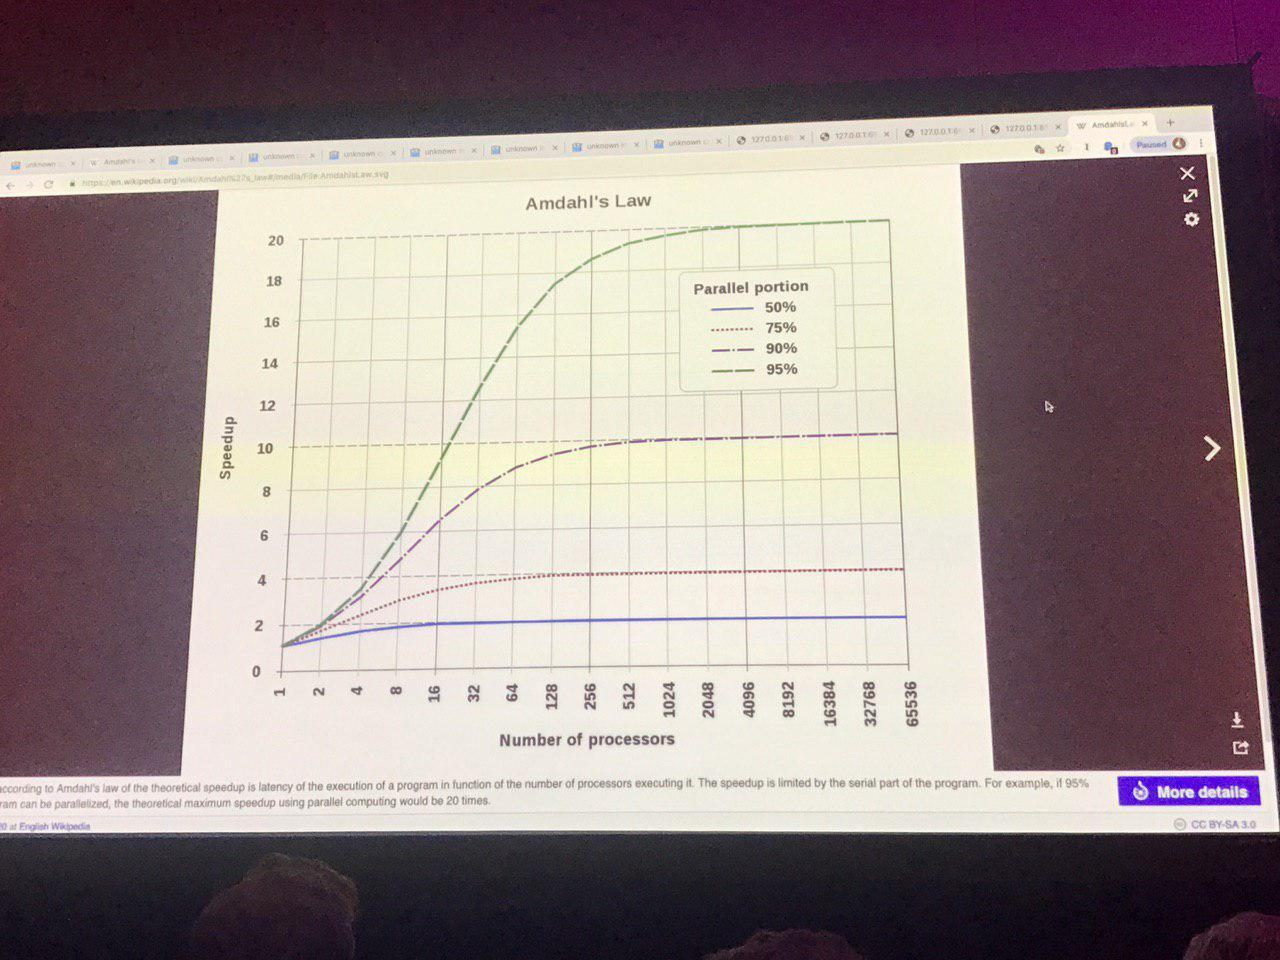
For this algorithm - more CPU's - better! If we have 1000 cores we can solve each row at the same. If we have 1000000 cores - we can compute every pixel in parallel. But we spend 50% of writing the image. But that's a sequential operation.
The speed is limited by serial part of an application that can not be paralleled.
Think about your own programs! How much of the work can be done in parallel?
The key is to make effectively all of the work in parallel.