


Exploring data visualization with D3.js and Cody
This article explores data visualizations using D3.js, covering its features, getting started, working principles, and how to create charts with the help of Cody.
James Amoo
Whether you’re a seasoned veteran or a budding enthusiast, join us to explore, learn, and collaborate as we collectively transform how we read, write, and fix code.
Our experts embody the spirit of collaboration and knowledge sharing. They generously contribute their expertise through insightful blog posts, videos, pull requests, and active participation on Discord and other social media.
Connect with them to learn from their experiences and broaden your understanding of AI, code search, and open source.
Pssst, we pay $250-$500 a blog post. Apply to be a guest author.
At Sourcegraph, we are committed to supporting the open source projects that form the backbone of our products. We actively contribute to various funding platforms, including thanks.dev, Open Collective, Stackaid, GitHub Sponsors, and more, to ensure the sustainability of these critical projects.


Sourcegraph actively participates in prominent industry events. We’re always eager to engage with fellow developers, potential partners, and talented individuals seeking career opportunities.
If you spot us at an event, don’t hesitate to approach — we’d love to connect and share our passion for code with you.
Pittsburgh, PA
YouTube
Las Vegas, NV
Chicago, IL
London, UK
San Francisco, CA
San Diego, CA
Vancouver, BC
Salt Lake City, UT
This article explores data visualizations using D3.js, covering its features, getting started, working principles, and how to create charts with the help of Cody.
James Amoo
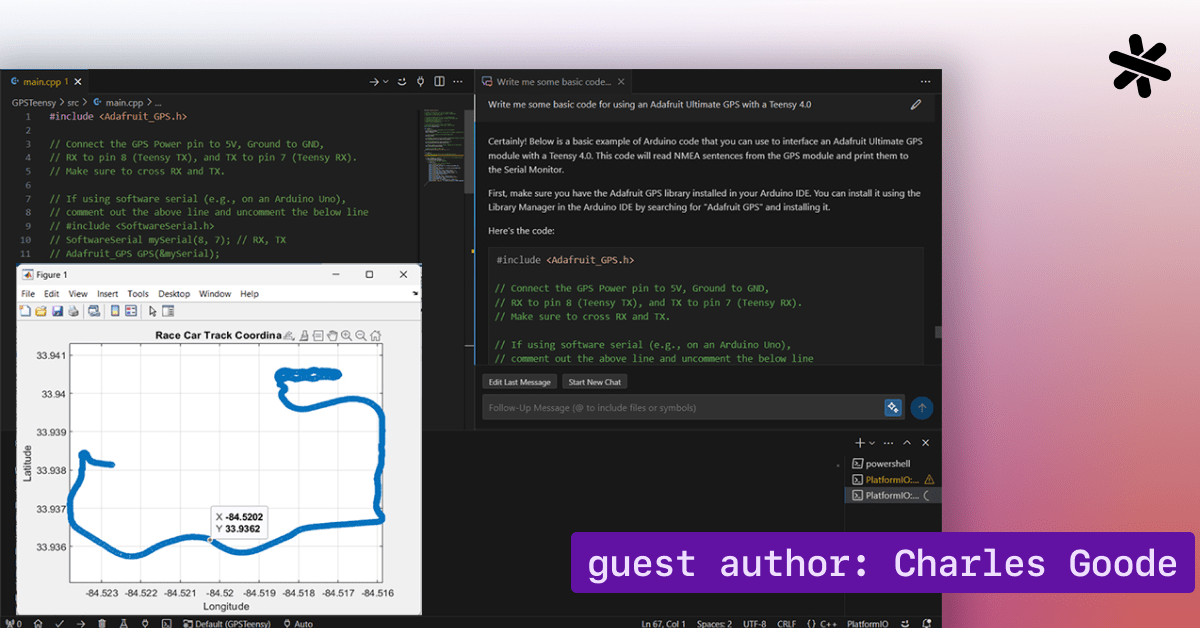
Charles Goode, an electrical engineering student at Kennesaw State University, shares his experience using Cody to rapidly implement a GPS data logging system for the university's Formula SAE racing team, Kennesaw Motorsports.
Charles Goode