Thyme: a simple CLI to measure human time and focus
It’s like a CPU profiler, but for your productivity rather than your machine’s
Do you ever think about how to make yourself a more productive programmer? At Sourcegraph, this is a question we think about every day. Our entire mission is to make your life as a developer easier and more efficient.
Thyme is a sampling profiler for your productivity.
Programmers seek out and use tools that we think will help us squeeze the most out of every minute of every hour of every day — but how well do these tools actually work? We need answers to questions like:
- Which applications do I have open the most? Which do I actually use the most?
- How often am I context-switching?
- What’s distracting me from my main focus?
- Where does all my time go?
Time-tracking programs are a dime a dozen, but when we looked around, we didn't find any that we’d want to use day-to-day as developers. Existing trackers made you manually enter information, use a clunky GUI, or didn't let you drill down into the data. We wanted a time-tracking utility that had all the things you’d expect from a great developer tool: a simple and easy CLI, full control and access to the raw data, and source code that’s hackable and open.
So we wrote Thyme, an open source command-line tool that lets you easily track and analyze the time you spend on your computer. Think of it as a sampling profiler, but for You instead of your machine.
Finding actionable productivity insights with Thyme
Thyme tracks which applications you use over time and then helps you explore the data to find actionable insights to boost your productivity. Here’s how I used it for this very purpose — as I was writing it.
Thyme was written in 2 parts. Part 1, which tracks application usage, was written first. Part 2 displays pretty charts, and was written the day after. Because I had the tracking code working before I wrote the charting logic, I was able to use Thyme to track my app usage as I wrote part 2. Here’s what I found.
Chart 1: Application usage timeline
This first chart shows application usage over the course of the afternoon, from 4pm to 8pm. On the chart, you can see that I had open 3 distinct applications: Google Chrome, Slack, and “beyang@claude~”. The last one is my terminal where I run Emacs (my computer’s name is “claude” — long story). Thyme splits the timeline into 3 rows:
- Active: which application has the focus
- Visible: which applications are currently visible on-screen
- All: all applications which currently have open windows

Thyme’s timeline of application usage
Observations:
- Both my terminal and Chrome were visible nearly the whole time. This is consistent with what you’d expect — I was using the terminal to write code in my editor and I was frequently referencing Chrome to look up documentation and usage examples.
- The “Active” row makes it crystal clear where I was context-switching frequently. You can see that the afternoon see-sawed between periods where I was mainly writing code in my editor and periods where I was actively switching between my editor and Chrome.
- I had Slack open in the background the whole time, but I barely used it.
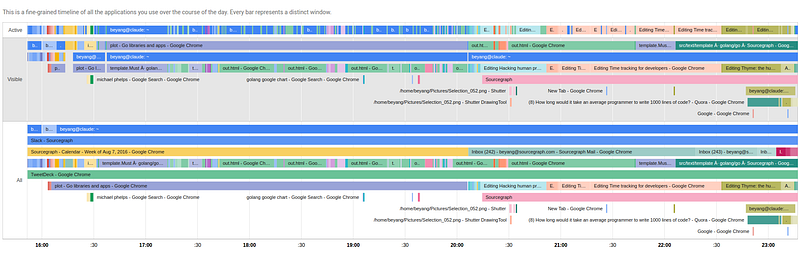
Chart 2: Detailed application usage breakdown
This second chart breaks down the timeline of application usage by window name. You can see what I was viewing in each application.

“Thyme”-line of application windows
Observations:
- In the “Active” row, you can see that the first 30 minutes of the afternoon was a period of high-frequency context switches. This was when I was deciding which charting library to use, so I was opening a new browser tab every minute and quickly scanning through docs.
- You can see where I became frustrated in the middle of looking for charting libraries. It’s the purple chunk of 5–10 minutes labeled “michael phelps — Google Search ”. The number of charting libraries to consider was overwhelming, so I temporarily gave up and started reading some news about the Olympics. (As a side note, holy cow Michael Phelps. What an athlete!)
- There's a solid 45-minute block of blue in the “Active” row between 16:30 and 17:30. I remember this period. It was when I wrote 70% of the code and it felt amazing. I was mainly referencing Sourcegraph (“template.Must — golang/go”) and the Google charts documentation. Everything I needed was in the Chrome window next to my editor so I was in the zone.
- The remainder of the afternoon shows more frequent context switches and felt less productive. I was mainly tweaking the UI and scanning through documentation for the charting library I was using. You can see frequent switches to “out.html”, which was the browser window that displayed the work-in-progress Thyme charts UI.
Chart 3: Which apps do you rely on overall?

This third chart shows an aggregate overview of which applications I used during my afternoon coding session. The interesting thing to note here is the differences in relative order between “open”, “visible”, and “active” applications. I had Slack open the whole time, but I basically never used it. Chrome was by far the most visible, because I was using it frequently to look up documentation and usage examples and test out the Thyme dashboard. But the application that I actually used the most was my terminal, which contained my editor.
Takeaways
Here are some concrete, actionable takeaways I took from diving into this data:
- Frustration leads to distraction. Googling around for different charting libraries and evaluating each on the relative strengths of their API, community, and documentation was an onerous process. Situations like this are dangerous, because you may throw your hands in the air and distract yourself with something that provides a quick hit of dopamine. But doing so often takes you further off the rails. Being generally aware of this fallacy is one thing, but actually seeing it in my Thyme timeline means I’ll be more likely to catch myself next time and stay focused.
- UI tweaks eat up a lot of time. After finishing up work, I’d felt that the UI tweaks had taken up more time than they should have. But with Thyme, I can confirm that they took more than 2.5 hours! Did it really have to take that long? Probably not. Like a runner who slows down as he nears the finish line, I knew I was basically done and let myself spend too much time playing around with parameters in the charting API. Next time, I’ll keep my eyes on the prize and work relentlessly toward it until I’m actually done.
- Sourcegraph is pretty handy. This is shameless self-promotion, but the evidence bears it out. The period of least context-switching and highest productivity occurred while I was using Sourcegraph to look up documentation and usage examples for the Go API I was using. That was a satisfying piece of validation, because the reason we created Sourcegraph was to cut down on wasteful context switches and save ourselves time when coding.
Thyme yourself
If you’re interested in using Thyme to investigate your own productivity, you can install Thyme here. It’s a single command line tool with 2 simple parts: a time tracker and a data visualizer.
The Thyme tracker snapshots all open windows on your computer at a a given point in time. You can have it output this information to a file. It’s like a sampling profiler, but instead of CPU time and processes, it looks at human time and open application windows. You can make it run every 30 seconds like this:
$ watch -n 30 thyme track -o thyme.json
The Thyme data explorer reads data from the tracker output file and shows a single page with interactive charts. You run it with a single command, too:
$ thyme show -i thyme.json -w stats > thyme.html
Then just open thyme.html in your favorite web browser and voila, you get the pretty charts you see above.
All the information Thyme collects is kept safely on your local disk so you have full control over your data. It never sends any information over the Internet.
Thyme currently supports Linux (with X-Windows) and macOS support is on the way soon. It’s built with simplicity and hackability in mind. The code is open source, well-documented, and easily extensible. Try it out and let us know what you think!
About the author
Beyang Liu is the CTO and co-founder of Sourcegraph. Beyang studied Computer Science at Stanford, where he published research in probabilistic graphical models and computer vision at the Stanford AI Lab. You can chat with Beyang on Twitter @beyang or our community Discord.